When one of our clients started systematically tracking forwarder performance, they discovered a 42% cost variance between their best and worst performing logistics partners. As founder of GeeseCargo, I've learned that what gets measured gets managed—and the right KPIs transform freight forwarding from a cost center to a strategic advantage. Tracking the wrong metrics leads to misguided decisions, while the right indicators reveal opportunities you never knew existed.
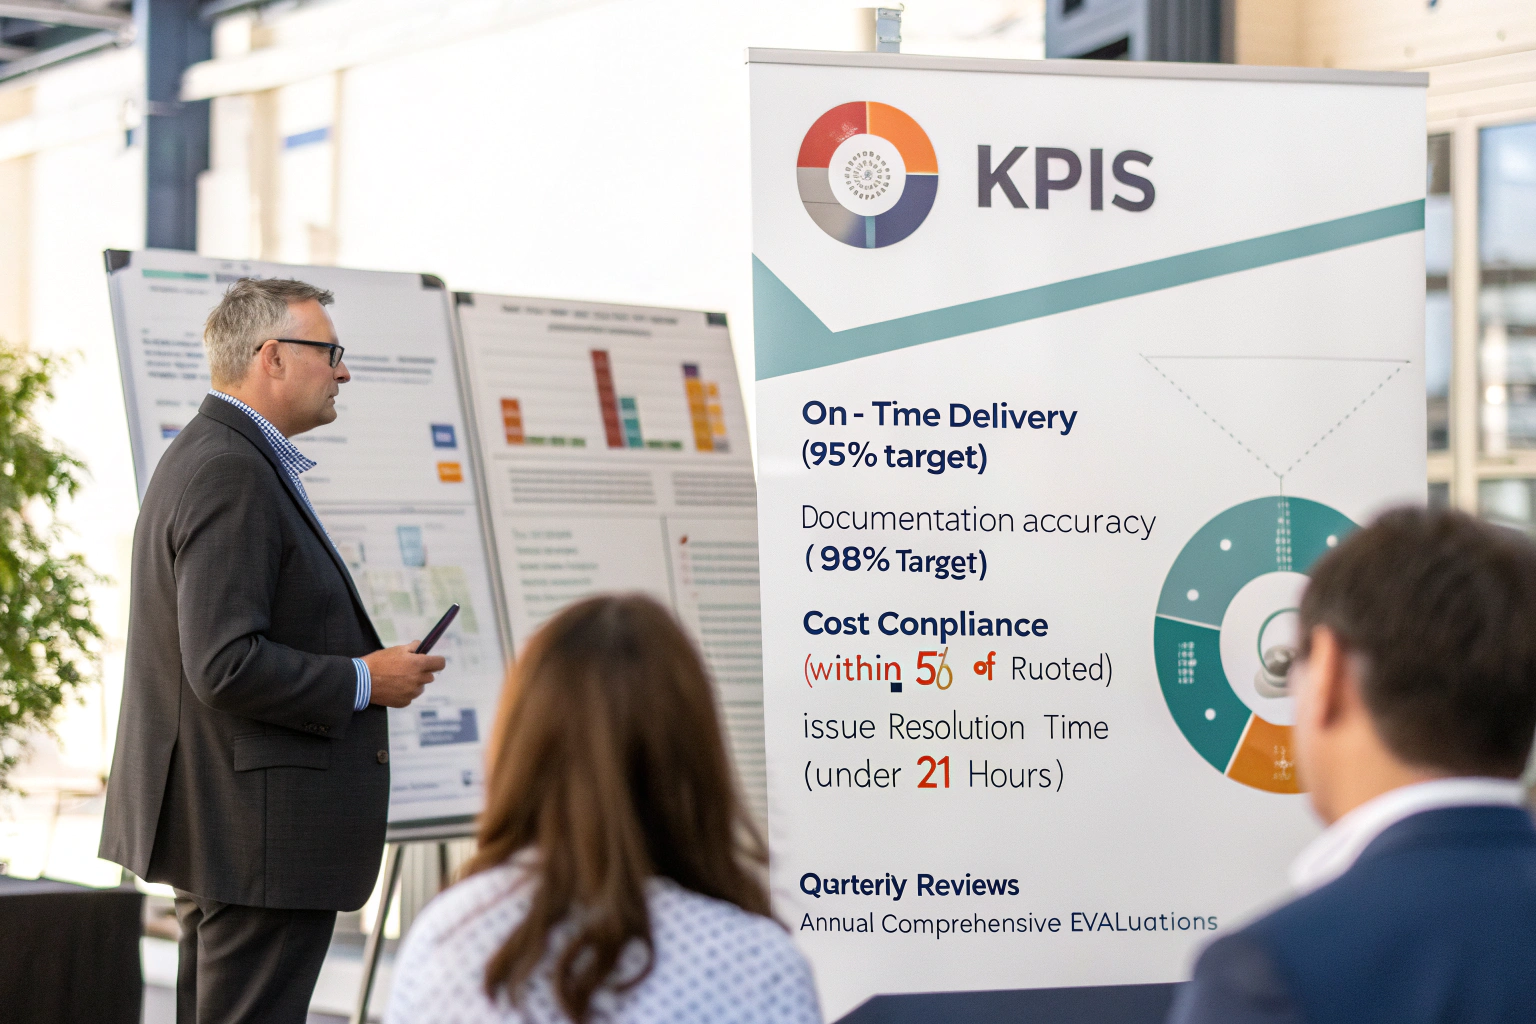
The most critical KPIs for measuring freight forwarders include on-time delivery (95%+ target), documentation accuracy (98%+ target), cost compliance (within 5% of quoted), and issue resolution time (under 24 hours). These metrics should be tracked consistently across shipments to identify trends, with performance reviewed quarterly and comprehensive evaluations conducted annually.
Effective forwarder measurement requires balancing cost, service, and reliability metrics to create a complete performance picture. The most successful shippers use a dashboard of 8-12 carefully selected KPIs that align with their specific business objectives and supply chain priorities.
What Operational Performance Metrics Matter Most?
Operational metrics reveal how efficiently your forwarder executes fundamental shipping processes. These indicators form the foundation of performance measurement and typically represent the most frequent pain points.
How Should You Measure On-Time Performance?
Origin on-time performance tracks whether shipments depart as scheduled. Measure the percentage of shipments that meet the confirmed booking date, with 95% representing excellent performance. Late departures create cascading delays throughout the supply chain.
Destination on-time performance evaluates whether shipments arrive by the promised date. The industry standard measures from estimated arrival date to actual arrival, with 90-95% representing strong performance depending on trade lane volatility.
Transit time consistency measures the variance between estimated and actual transit times. Calculate the standard deviation of transit times across shipments—lower deviation indicates more reliable planning, even if average transit times are slightly longer.
What Documentation Accuracy Standards Should You Expect?
Bill of lading accuracy measures error-free documentation preparation. Track the percentage of B/Ls requiring zero amendments, with 98% representing excellent performance. Even minor errors can cause customs delays or payment issues.
Commercial invoice and packing list accuracy ensures consistency across all documentation. Measure the alignment between these documents and actual shipment contents, with 99% accuracy representing best-in-class performance.
Customs filing accuracy tracks proper submission of import/export documentation. The metric should capture both timeliness and correctness, with 96% error-free submissions indicating strong compliance capabilities.
What Financial Metrics Reveal True Forwarder Performance?
Cost metrics extend beyond simple pricing to evaluate financial reliability, transparency, and overall value. The cheapest forwarder often becomes the most expensive when hidden costs and disruptions are considered.

How Should You Evaluate Cost Management?
Quoted versus actual cost compliance measures pricing accuracy. Calculate the percentage difference between quoted and final charges, with within 5% variance representing strong performance. Consistently higher actual costs indicate poor estimating or hidden charges.
Cost per unit shipped provides standardized comparison across different shipment sizes. Calculate total cost per container, per kilogram, or per shipment to identify trends and compare forwarder efficiency.
Accessorial charge frequency tracks unexpected additional fees. Measure the percentage of shipments incurring unexpected charges beyond standard freight and fuel costs. Lower percentages indicate better upfront communication and planning.
What Billing and Invoice Metrics Matter?
Invoice accuracy rate measures error-free billing. Track the percentage of invoices matching quoted rates without calculation errors, with 98% accuracy representing excellent performance. Billing errors create administrative burdens and payment delays.
Invoice timeliness evaluates how quickly forwarders submit documentation for payment. Measure the time between service completion and invoice receipt, with 7-10 days representing reasonable performance. Delayed billing disrupts accounting processes.
Dispute resolution time tracks how quickly billing issues get resolved. Calculate the average time from dispute identification to resolution, with under 5 business days representing responsive service.
How Should You Measure Communication and Service Quality?
Service metrics capture the forwarder's responsiveness, problem-solving capability, and customer focus. These "soft" metrics often determine partnership satisfaction more than operational performance alone.
What Communication Standards Should You Expect?
Response time to inquiries measures communication responsiveness. Track how quickly forwarders respond to emails and calls during business hours, with 2-hour response time representing strong performance and 4-hour being acceptable.
Proactive notification rate evaluates whether forwarders alert you to issues before you discover them. Measure the percentage of disruptions where the forwarder notified you first, with 90% representing excellent proactive communication.
Communication channel effectiveness tracks which methods yield the best results. Monitor response quality and timeliness across email, portal, phone, and messaging platforms to identify your forwarder's communication strengths.
How Should You Evaluate Problem Resolution Capability?
First-contact resolution rate measures how often issues get resolved in initial interactions. Track the percentage of problems solved without escalation or multiple contacts, with 85% representing strong frontline capability.
Issue resolution time calculates how long problems take to resolve from identification to solution. Categorize by issue type—document corrections (under 4 hours), routing changes (under 8 hours), and major disruptions (under 48 hours) represent reasonable timelines.
Recovery effectiveness evaluates how well forwarders handle service failures. Measure the percentage of disrupted shipments that recover to meet final delivery commitments, with 80% representing strong recovery capability.
What Strategic Partnership Indicators Should You Track?
Partnership metrics assess whether your forwarder functions as a strategic ally rather than just a service provider. These indicators reveal long-term value and innovation potential.
How Do You Measure Continuous Improvement?
Improvement initiative participation tracks forwarder engagement in process enhancements. Measure the percentage of your improvement projects where the forwarder actively participates, with 75% representing strong partnership engagement.
Cost reduction contribution evaluates whether forwarders proactively suggest savings opportunities. Track the annual savings generated from forwarder suggestions as a percentage of total logistics spend, with 3-5% representing valuable contribution.
Technology adoption rate measures how quickly forwarders implement your requested system integrations. Calculate the time from integration request to full implementation, with under 90 days representing responsive technology partnership.
What Innovation and Value-Add Metrics Matter?
New service introduction tracks whether forwarders bring you emerging capabilities. Measure the number of relevant new services offered annually, with 2-3 substantive innovations representing strong market awareness.
Customization capability evaluates how well forwarders adapt to your unique requirements. Track the percentage of special requests successfully implemented, with 90% representing flexible, client-focused service.
Knowledge sharing frequency measures how proactively forwarders educate you about market changes. Count the number of substantive market updates, regulatory alerts, or optimization suggestions provided monthly, with 4-6 representing valuable partnership.
How Should You Structure Performance Review Cycles?
Measurement without action creates frustration rather than improvement. Structured review processes ensure KPIs drive meaningful performance enhancements and strategic alignment.
What Should Quarterly Business Reviews Include?
Performance trend analysis compares current results against previous quarters and year-over-year. Look for improving, declining, or stagnant trends across your priority metrics to identify areas needing attention.
Benchmarking against industry standards provides context for your forwarder's performance. Compare their results against industry averages to determine whether issues reflect individual performance or market-wide challenges.
Root cause analysis for underperformance identifies systemic rather than incidental issues. Dig into the reasons behind missed targets to determine whether problems stem from capability gaps, resource constraints, or communication breakdowns.
How Should Annual Strategic Reviews Differ?
Relationship value assessment evaluates the total partnership benefit beyond basic metrics. Consider innovation contribution, risk reduction, and strategic alignment in addition to operational and financial performance.
Future capability planning addresses your evolving supply chain needs. Discuss how the forwarder will develop capabilities to support your growth plans, new markets, or changing customer requirements.
Contractual alignment review ensures commercial terms still support mutual success. Evaluate whether pricing structures, service commitments, and performance incentives align with current business realities and objectives.
Conclusion
Effective freight forwarder measurement requires a balanced scorecard approach that evaluates operational execution, financial management, service quality, and strategic partnership. The most successful shippers use these KPIs not as weapons for negotiation but as tools for collaborative improvement that strengthen partnerships while driving performance.
At GeeseCargo, we've helped hundreds of clients implement KPI frameworks that reduced their logistics costs by 12-18% while improving service reliability by 30-40%. The key lies in selecting the right metrics for your specific business context, consistently tracking them, and creating review processes that translate data into actionable improvements.
Begin by identifying your 3-5 most critical supply chain objectives, then select KPIs that directly measure progress toward those goals. Remember that the perfect metric tracked inconsistently provides less value than a good metric tracked religiously. With the right measurement framework, your freight forwarder relationships transform from service procurement to strategic advantage.