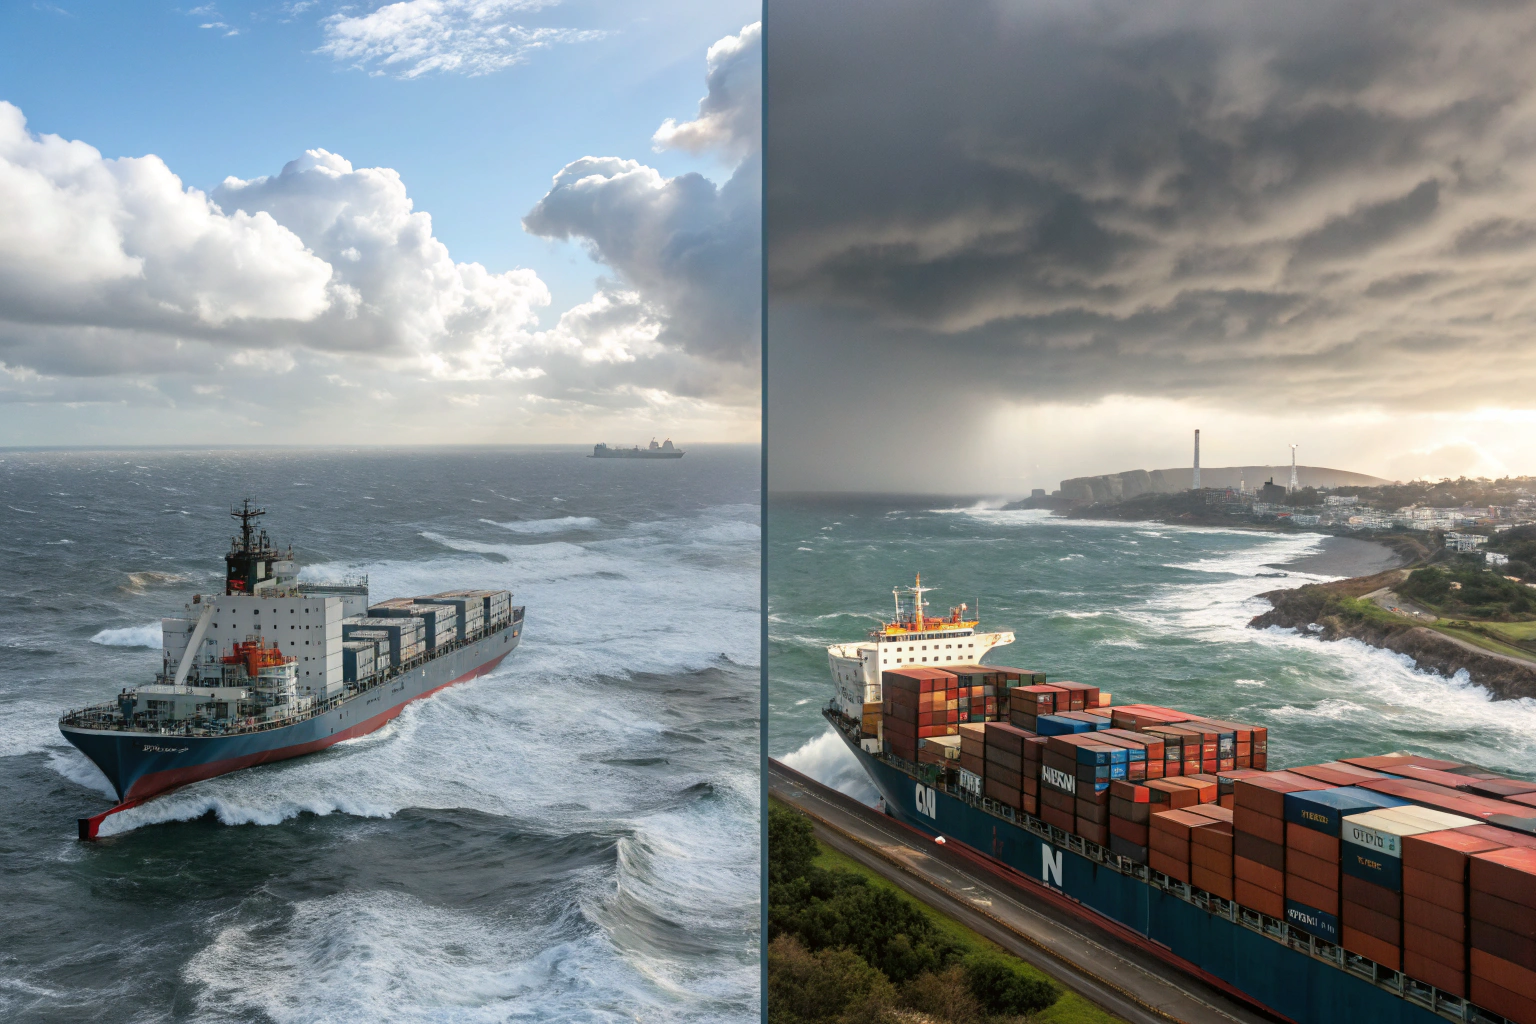
Rising shipping costs and fluctuating demand have led many importers to re-evaluate which coast—East or West—is more cost-effective for receiving goods from China in July 2025. With rates dropping sharply on certain routes, timing and port choice are now directly tied to your margins.
This article compares port congestion, transit time, cost, and inland distribution when importing from China to the U.S., helping importers like you determine which coast actually offers more value in July 2025.
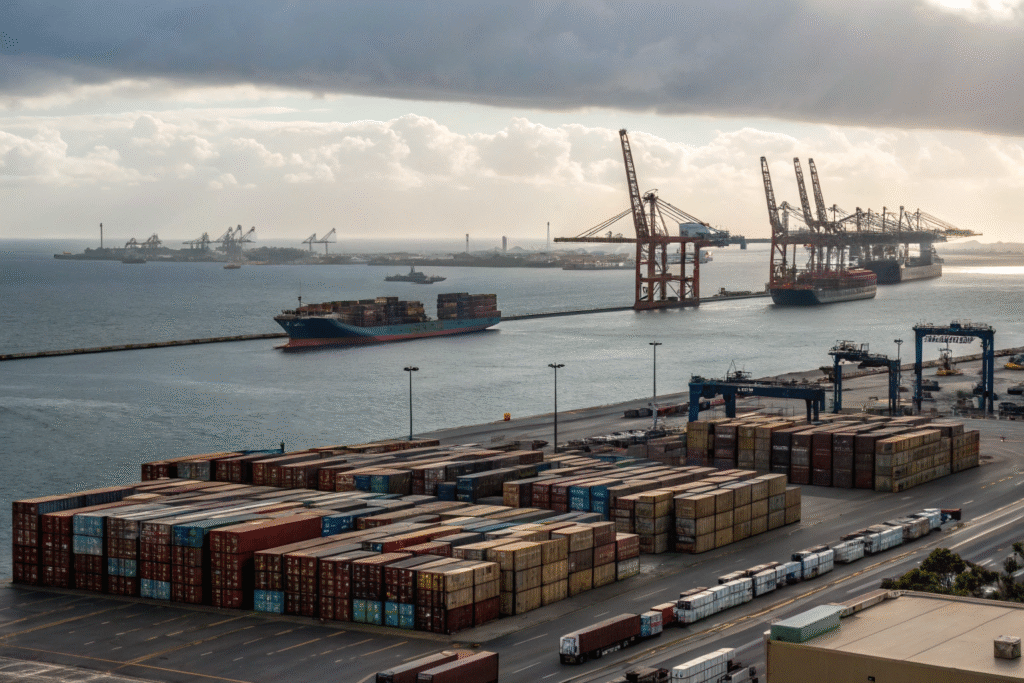
Let’s weigh the logistics, numbers, and strategic factors to determine where your shipments should dock.
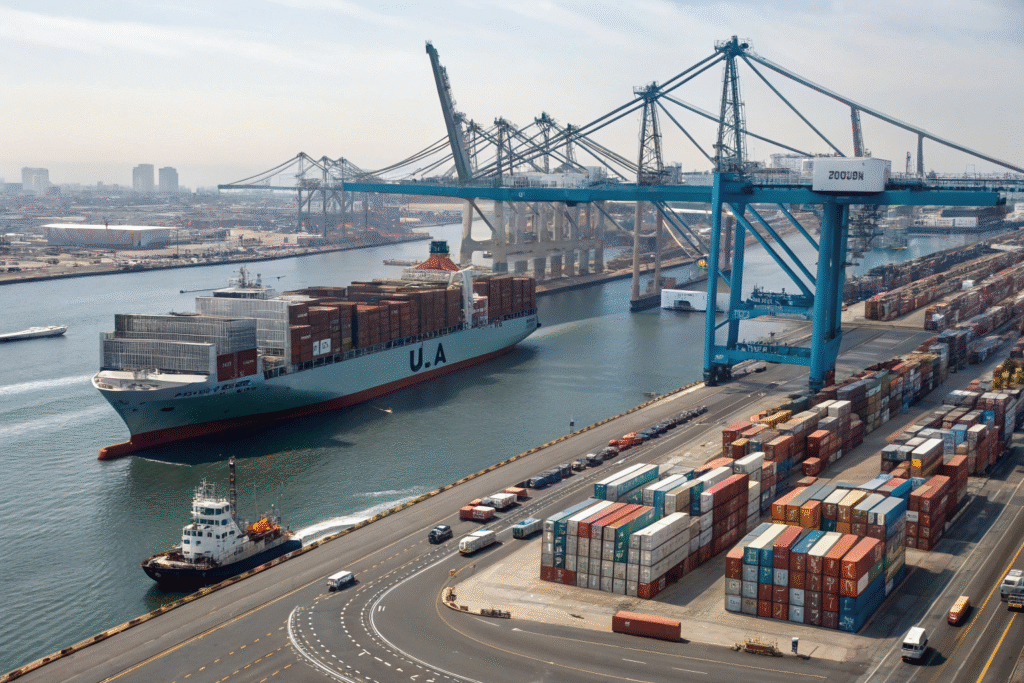
Which U.S. Ports Have the Lowest Ocean Freight Rates in July 2025?
Since early June 2025, rates for shipping from major Chinese ports like Ningbo and Yantian to Los Angeles have fallen more than 63%. That’s the lowest point in over two years. Meanwhile, rates to the Port of New York/New Jersey remain comparatively higher.
As of July 2025, the average cost per 40-foot container is:
| Route | Avg Cost per FEU (40ft) | % Drop YoY |
|---|---|---|
| China → Los Angeles | $1,550 | -63% |
| China → New York | $2,900 | -31% |
Why Is the West Coast Cheaper Right Now?
Labor disruptions have eased at West Coast ports, and demand is still soft post-pandemic. Major freight forwarders and shippers redirected volume early in 2023, which left West Coast capacity underutilized.
Find weekly updates at Freightos Baltic Index and Xeneta Market Insights.
Are These Rates Sustainable?
Short answer: not likely. Ocean carriers are already considering blank sailings to control capacity. That means now is a rare opportunity to lock in lower rates and increase shipping frequency to West Coast destinations before Q3 peak season hits.
Explore July rate trend forecasts at Drewry World Container Index.
Which Route Offers Faster Transit and Fewer Delays?
Time is money. Transit time from China to the U.S. West Coast typically takes 14–18 days, while shipping to the East Coast via Panama Canal can stretch to 30–35 days.
In July 2025, average port-to-door lead times are:
| Route | Avg Ocean Transit | Total Door-to-Door |
|---|---|---|
| China → LA | 16 days | 21–24 days |
| China → NY | 34 days | 37–42 days |
What Causes East Coast Delays?
In July 2025, the Panama Canal continues to experience low water levels, reducing vessel slots. Additionally, East Coast rail congestion has worsened due to higher eCommerce volumes in the Northeast.
Stay updated via Panama Canal Authority and American Shipper.
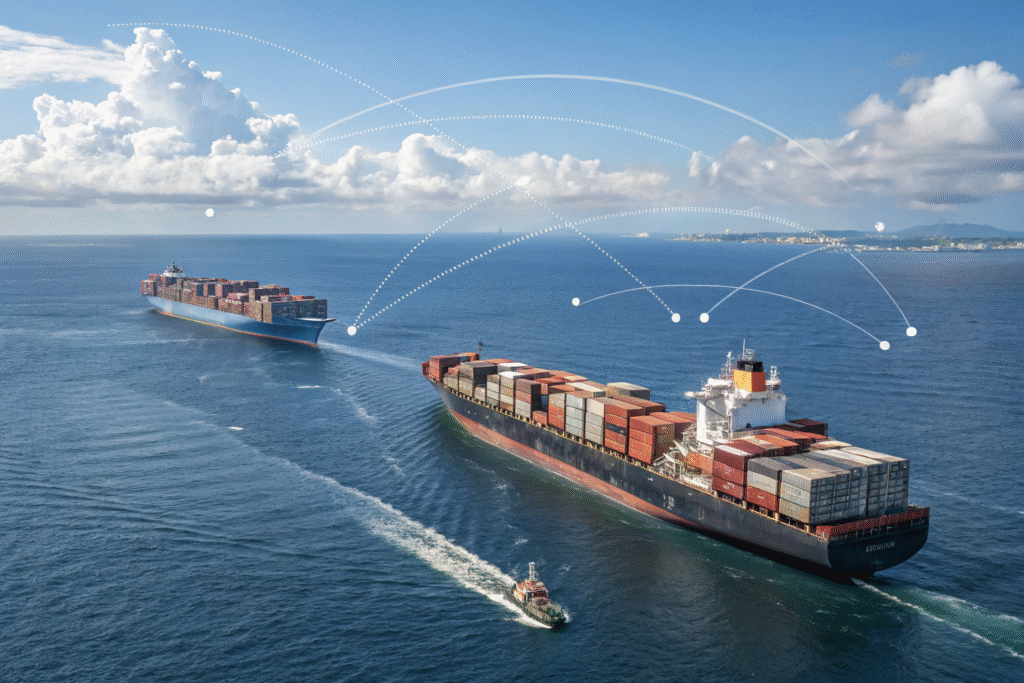
How Does GeeseCargo Reduce Delay Risk?
We monitor daily vessel tracking, partner with multiple terminal operators, and pre-book containers through fixed weekly allocations, especially on the Shanghai–LA route. This gives our clients flexibility when blank sailings or congestion strikes.
You can check real-time ship positions at MarineTraffic or FleetMon.
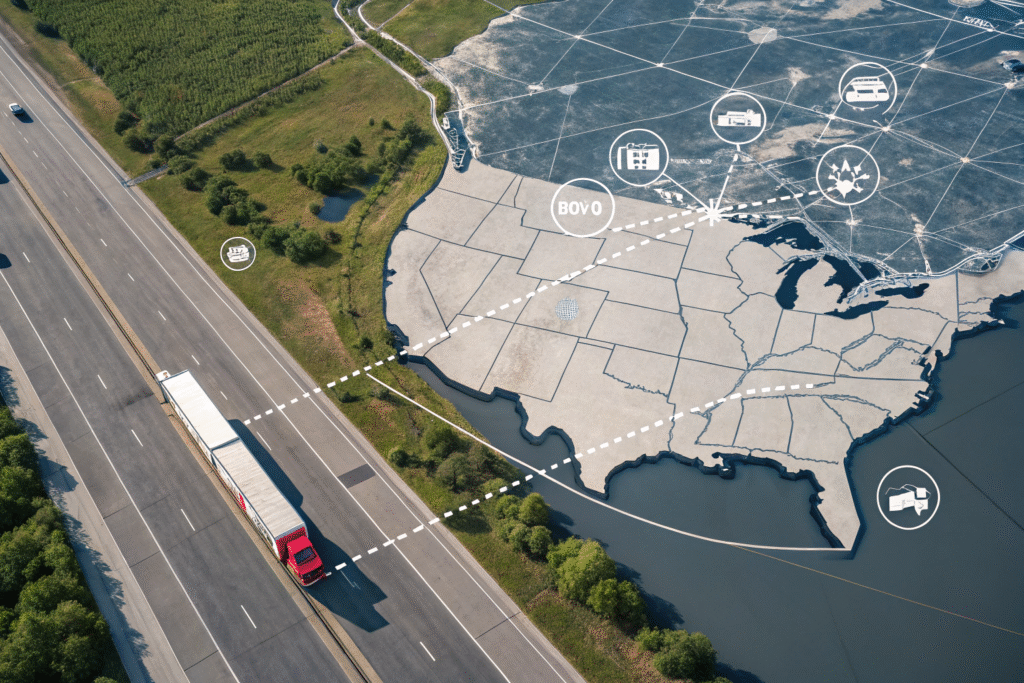
What Are the Differences in Inland Transportation Costs?
Port fees are only part of the total cost. Inland transportation often flips the savings script, depending on your warehouse location.
For example, if your fulfillment center is in Chicago, Dallas, or Atlanta, routing through the East Coast could cost less overall—even with higher ocean freight rates.
When Is East Coast More Efficient?
- Goods destined for Midwest or South
- Want to avoid LA traffic and I-10 delays
- Rail intermodal contracts are already in place
Reference shipping estimates at U.S. Freight Rail Map by AAR or DAT Freight Index.
When Is West Coast Still Superior?
- Final delivery to California, Arizona, Nevada
- Time-sensitive products needing quick customs clearance
- Sea-to-air conversion options for urgent orders
At GeeseCargo, we help clients calculate landed cost differentials between entry ports using predictive analytics via our WMS.
Which Port Route Offers Better Resilience During Peak Season?
The real test of a port's value comes in August to October, when pre-holiday shipping peaks. Choosing the wrong coast in July could mean port gridlock by Q3.
In July 2025, resilience rankings are:
| Metric | West Coast | East Coast |
|---|---|---|
| Blank Sailings | Low | Medium |
| Labor Stability | Medium | High |
| Weather Disruption | Medium | Low |
| Port Throughput Speed | High | Medium |
What Do Major Retailers Prefer?
Retailers like Walmart and Target are splitting loads: 50% to West Coast, 30% to Gulf Coast, 20% to East Coast, using forward positioning based on seasonal demand.
Check Retail Dive and Supply Chain Dive for current strategies.
Should You Use Mixed Port Strategies?
Yes. If you’re shipping high volume, consider splitting containers between LA and Savannah or NY, depending on SKUs and warehouse zoning. This spreads risk and increases delivery flexibility.
We at GeeseCargo offer multi-port routing planning based on inventory type, urgency, and customs complexity.
Conclusion
In July 2025, the West Coast route from China offers a clear cost and time advantage for most shipments—particularly if your warehouse is in the Western U.S. or if you're rushing to beat peak season congestion.
But if your goods are headed inland or to the South and East, you should weigh the higher ocean freight costs to the East Coast against the lower inland transport fees.
The key takeaway? Your ideal route isn’t just about the lowest rate—it’s about total delivery time, reliability, and your final warehouse ZIP code.
At GeeseCargo, we offer tailored consultations to calculate your best port strategy—so you save more, move faster, and avoid port-related surprises during the busiest months of the year.