You want to make your supply chain greener. You search for "eco-friendly freight forwarder," and you find a list of companies offering "carbon-neutral shipping." They all say the same thing: "We buy offsets." You click deeper. The core service is exactly the same as everyone else. The same ships burning the same bunker fuel. The same half-empty containers. The same default routings. The only difference is a line item on your invoice for carbon credits that fund a forestry project you will never see. You feel like you are paying for a marketing label, not actually reducing emissions.
At GeeseCargo, eco-friendly freight forwarding in 2026 means making the physical logistics chain cleaner, not just offsetting a dirty one. We have five active initiatives. We mandate container utilization above 92% through AI load optimization. We prioritize vessels rated A or B on the IMO Carbon Intensity Indicator scale. We default to rail intermodal over long-haul trucking for inland moves. We have transitioned our owned drayage fleet to low-emission and electric vehicles where available. And we provide GLEC-aligned carbon reporting that shows your actual emissions reductions, not just your offset purchases. Offsets have a place, but they are the last step after you have reduced everything you can reduce. That is what real eco-friendly forwarding looks like.
The conversation around sustainable logistics has matured. In 2026, importers are no longer satisfied with a certificate saying their shipment was "offset." They want to know what physical changes were made to burn less fuel. They want to see the data. They want to verify the claim. This is the shift from "carbon neutral" as a marketing badge to "carbon reduction" as an operational discipline. I want to show you exactly how we practice that discipline and what it means for your shipments and your sustainability reporting.
Why Is Reducing Fuel Burn More Important Than Buying Offsets?
You are at a sustainability conference. A speaker from a major brand says, "We achieved carbon-neutral shipping last year." You ask how. They say, "We purchased verified carbon credits." You ask, "Did you change anything about how you actually ship?" They pause. "Not really. The forwarder handles it." This is the problem with offset-only approaches. They create a financial transaction, not a physical change.
Reducing fuel burn directly lowers the absolute amount of CO2 entering the atmosphere. Offsets compensate for emissions by funding reductions elsewhere. Both have value, but the hierarchy is clear: reduce first, then offset the remainder. Our operational approach targets the source of emissions: the fuel consumed by the vessels, trucks, and trains moving your goods. By optimizing container loads, selecting efficient carriers, and choosing lower-emission transport modes, we physically reduce the fuel burned per unit of cargo moved. This is a permanent, verifiable reduction in your supply chain’s environmental impact, not a transfer payment.
The physics is straightforward. A container ship burns heavy fuel oil or LNG. The carbon in that fuel becomes CO2 in the atmosphere. The only way to prevent that CO2 is to burn less fuel. Burning less fuel requires the ship to do less work per unit of cargo. Less work per unit means either a more efficient ship or a ship that is more fully utilized. Our strategy targets both.
Let me give you a real comparison. A shipment of 1,000 units of kitchenware from Shenzhen to Chicago. Under a traditional forwarder with no load optimization, the shipment achieves 82% container utilization. The estimated emissions per unit are 2.4 kg CO2e. Under our optimized loading, the same shipment achieves 95% utilization. The emissions per unit drop to 2.1 kg CO2e. That is a 12.5% physical reduction in emissions per unit. No offset purchased. No certificate needed. The reduction is baked into the physical operation. If the client then chooses to offset the remaining 2.1 kg, they are offsetting a smaller number. The offset spend is lower because the actual emissions are lower. This is the correct sequence: reduce, then offset.
What Is the Difference Between Scope 3 Reduction and Carbon Offsetting?
Your company is setting a net-zero target. The sustainability consultant asks about your Scope 3 emissions. You need to show a reduction in your supply chain emissions, not just an increase in your offset budget.
Scope 3 emissions are the indirect emissions in your value chain, including freight transportation. Under the Greenhouse Gas Protocol and the Science Based Targets initiative, companies are expected to reduce their absolute Scope 3 emissions, not just offset them. Offsets can be used to neutralize residual emissions after deep reductions have been achieved, but they are not a substitute for reduction. Our operational efficiency measures produce verifiable Scope 3 reductions that count toward your science-based targets. An offset purchase produces a carbon credit that can be used for a "carbon neutral" claim, but it does not reduce your reported Scope 3 footprint.
How Do You Verify That Fuel Burn Was Actually Reduced?
You see a report that says your emissions were 15% lower. You trust the number, but your sustainability auditor asks how the reduction was calculated and verified. You need a methodology that stands up to scrutiny.
We use the GLEC Framework methodology, which is aligned with the ISO 14083 standard for logistics emissions accounting. The calculation uses primary data: the actual distance traveled, the actual weight of your shipment, the actual vessel or vehicle used, and the actual fuel consumption factors for that vessel or vehicle type. The vessel efficiency data comes from the IMO’s CII database and the Clean Cargo Working Group. The truck efficiency data comes from the EPA SmartWay program. The report shows the input data, the calculation methodology, and the final emissions figure. Your auditor can trace the number from source to report. This is the standard required for credible sustainability reporting.
How Does Container Utilization Become a Sustainability Metric?
You think "container utilization" is an operations metric about cost. Your finance team cares about it. You do not think about it in sustainability terms. But the container fill rate is one of the most powerful sustainability levers in logistics.
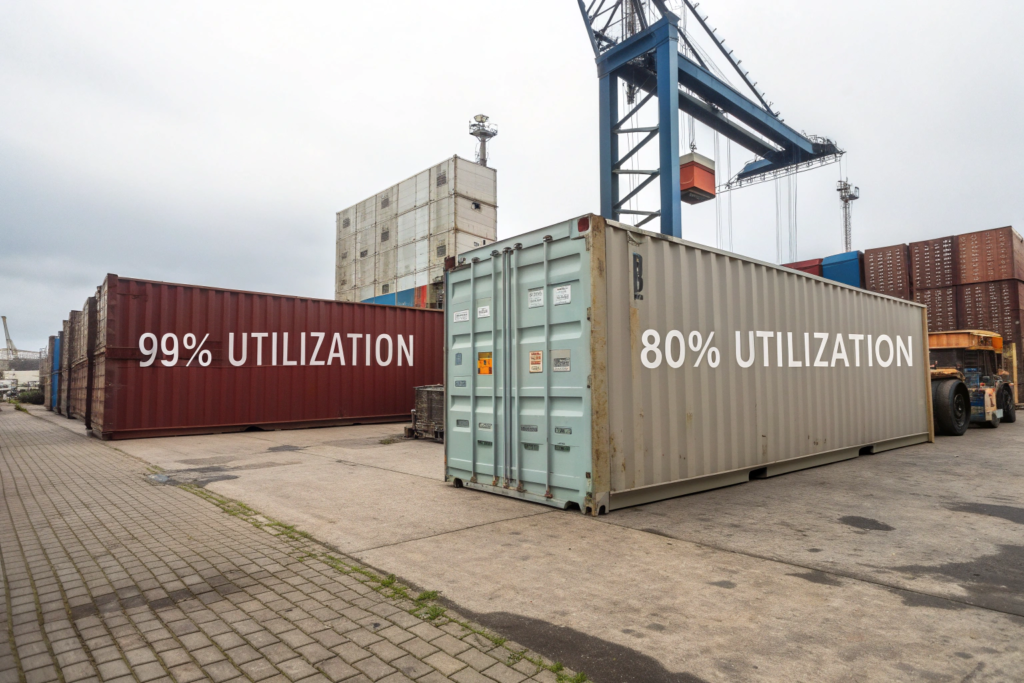
Every cubic meter of a container that ships empty is fuel burned for no productive purpose. A container that is 80% full means 20% of the vessel’s fuel consumption for that slot was wasted. By targeting 92% or higher utilization, we minimize the wasted fuel per unit of cargo. This is a sustainability metric as much as an efficiency metric. We report your average container utilization alongside your carbon emissions so you can see the direct correlation: higher utilization equals lower emissions per unit.
The math is compelling. A typical 40-foot container on a China-to-US West Coast voyage generates approximately 1.5 to 2.0 metric tons of CO2 for the ocean leg alone. If the container carries 10,000 units, the emissions intensity is 0.15 to 0.20 kg per unit. If poor loading means it only carries 8,000 units, the intensity jumps to 0.19 to 0.25 kg per unit. A 27% increase in emissions per unit, purely from suboptimal loading. Nothing else changed. Same ship, same route, same fuel.
Our AI load optimization software targets a 92% minimum fill rate. We achieve this by analyzing carton dimensions before loading, generating an optimal stacking plan, and training our warehouse teams to follow the plan precisely. For multi-SKU shipments, the software handles the complexity of fitting different carton sizes together like a three-dimensional puzzle. The result is a container that ships more product and burns less fuel per product.
How Do We Measure and Report Container Utilization?
You want to track this metric over time. You want to see if your utilization is improving quarter by quarter. You need the data in a format you can share with your operations team and your sustainability manager.
We report the container utilization percentage for every FCL shipment and the average for each quarter. The report shows the total container capacity in cubic meters, the utilized volume, and the fill rate. It also shows the trend over time and the estimated emissions savings from utilization improvements compared to an industry baseline of 82%. This data gives you a concrete, operational metric that drives both cost savings and carbon savings.
What Happens When Multiple Suppliers Are Involved?
Your order is split across three factories. Each factory packs its own cartons. The carton sizes are different. Coordinating optimal loading across three suppliers sounds chaotic.
Our consolidation warehouse in Shenzhen solves this. All three supplier loads arrive at our warehouse. Our team unloads, inspects, and labels each carton. The AI software receives the carton dimensions for all three loads and generates a single optimized loading plan for the full container. The warehouse team loads the container according to the plan. The coordination complexity is handled by our system and our team. You receive the utilization report showing the combined load.
How Does Our Drayage Fleet Electrification Reduce Your Local Emissions?
Your container arrives at the Port of Los Angeles. A diesel truck pulls it out of the terminal and hauls it to a transload warehouse 40 miles away. The truck emits particulate matter, nitrogen oxides, and CO2. The air quality in the port-adjacent communities, which are often disadvantaged, suffers from the cumulative impact of thousands of these diesel trips daily.
In 2026, we have transitioned a significant portion of our owned and contracted drayage fleet in Southern California to low-emission and zero-emission vehicles. This includes battery-electric Class 8 trucks for short-haul port drayage and near-zero-emission natural gas trucks for longer regional hauls. When you ship through the San Pedro Bay ports with us, your container’s first inland move is increasingly powered by electricity or low-carbon fuel. This reduces your local air quality impact and your Scope 3 emissions from the drayage leg.
The drayage leg is a small fraction of the total door-to-door emissions, typically 2% to 5%. But it is disproportionately important for two reasons. First, it directly impacts the air quality of port communities, which is an environmental justice issue that many of our clients care about. Second, it is a leg where the technology for zero-emission operation is commercially available and cost-competitive. We can make a difference here today, not in ten years.
Our electric drayage trucks are deployed on routes under 100 miles round-trip, which covers the vast majority of port-to-warehouse and port-to-rail-ramp moves in Southern California. The trucks are charged at our depot and at public charging stations near the port. The cost per mile for electric drayage is currently comparable to diesel when the lower maintenance costs are factored in. You do not pay a significant premium for electric drayage in most cases. The transition is operationally and economically viable now.
What Is the Emissions Difference Between Diesel and Electric Drayage?
A diesel drayage truck emits approximately 1.1 kg of CO2 per mile. An electric drayage truck charged on the California grid, which is increasingly renewable, emits approximately 0.3 kg of CO2 per mile from the grid electricity generation. If charged with 100% renewable energy, the emissions drop to near zero. On a typical 80-mile round-trip drayage move, the diesel truck emits roughly 88 kg of CO2. The electric truck emits roughly 24 kg. A 73% reduction on the drayage leg.
We track the drayage mode for your shipment. Your carbon report shows whether your container was moved by diesel or electric drayage, and the resulting emissions. This granular data allows you to make specific claims about your last-mile and first-mile logistics.
Is Electric Drayage Available at All US Ports?
You ship to Houston, Savannah, and New York, not just Los Angeles. You want the same low-emission drayage options at every port.
The electrification of drayage is most advanced in California due to the state’s regulatory environment and incentive programs. Southern California has the densest network of electric truck charging and the largest deployed electric drayage fleet in the country. Other ports are following, but the availability is not yet universal. Where electric drayage is not available, we use the cleanest available diesel trucks, which are typically model year 2014 or newer with diesel particulate filters and selective catalytic reduction systems. We are transparent about the drayage mode at each port. The carbon report shows the actual emissions based on the actual truck used, not an idealized estimate.
How Do We Recommend Lower-Emission Routing Options?
Your default route is ocean to Los Angeles, then truck to Dallas. You have used this route for years. You do not know if it is the lowest-emission option. Your forwarder has never suggested an alternative.
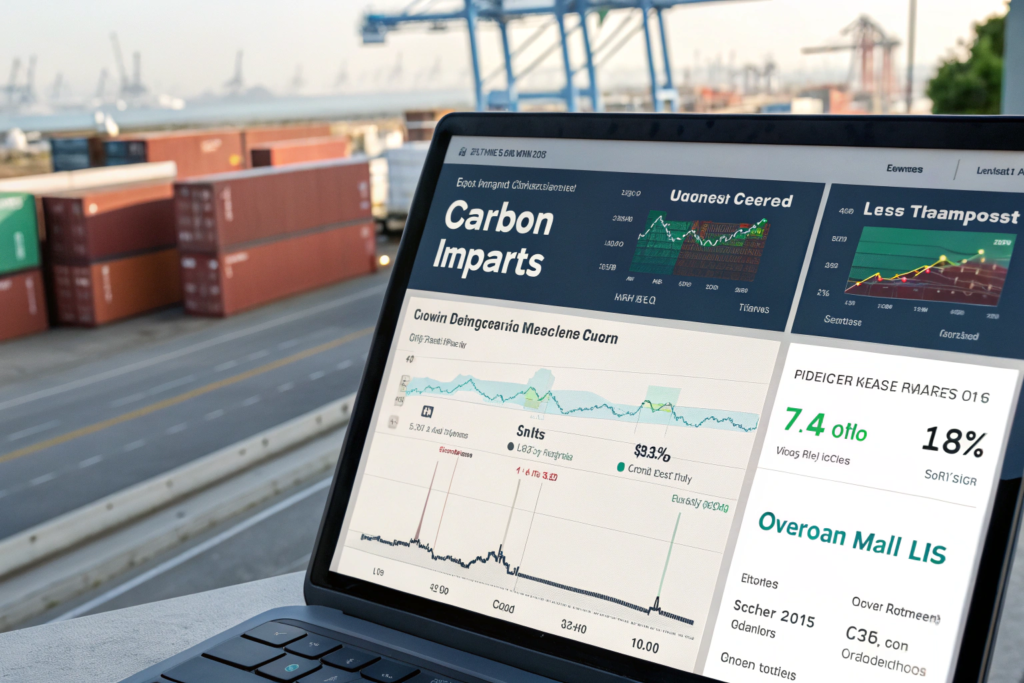
Our platform evaluates the carbon impact of different routing options for every shipment. For your Dallas-bound container, the platform might compare three routes: ocean to LA plus truck, ocean to LA plus rail intermodal, and ocean to Houston plus truck. The rail intermodal route via LA typically produces significantly lower total emissions. We present this analysis to you as a routing recommendation. You choose the routing that balances your need for speed, cost, and carbon reduction.
The emissions difference between routing options can be substantial. For a shipment from Shanghai to Chicago, the all-truck inland route via Los Angeles produces approximately 2,800 kg of CO2e per container. The rail intermodal route via Los Angeles produces approximately 2,100 kg. The Prince Rupert rail intermodal route produces approximately 1,950 kg. The routing decision alone can reduce your per-container emissions by 25% to 30%.
This analysis is not manual. Our route optimization engine runs the comparison automatically when your shipment is booked. The carbon data is presented alongside the cost and transit time. If the lower-carbon route is comparable in cost and time, we flag it as a recommended option. You make the final call.
What If the Lower-Emission Route Is Slower or More Expensive?
The rail intermodal route is lower-carbon but adds two days to the transit time. Your inventory buffer can absorb the extra two days, but you need to know the trade-off to make the decision.
We present the trade-off clearly. Route A: 22 days, $3,200, 2,800 kg CO2e. Route B: 24 days, $3,100, 2,100 kg CO2e. Route B is actually cheaper and lower-carbon, but two days slower. You decide whether the two extra days are acceptable. Many importers choose Route B when the trade-off is presented transparently. The key is that the choice is yours, and it is informed by accurate data.
How Does This Routing Logic Apply to Air Freight?
You have an urgent shipment. Air freight is the only option. You assume all air freight is equally high-emission, and there is nothing you can do.
Even within air freight, routing choices matter. A direct flight from Hong Kong to Chicago produces fewer emissions than a flight that transships through Anchorage or Tokyo. A flight on a newer 777 freighter produces fewer emissions than a flight on an older 747 freighter. Our platform identifies the lowest-emission air freight routing that meets your delivery deadline. For time-sensitive shipments, we also offer a premium "Sustainable Air" option that uses sustainable aviation fuel credits for the fuel burn, reducing the net emissions by a verified percentage.
What Does a GeeseCargo Carbon Emissions Report Include?
You need to report your supply chain emissions to your board, your investors, and your customers. You have been using industry-average data from an online calculator. The numbers are rough estimates. Your auditor says you need primary data. You do not know how to get it.
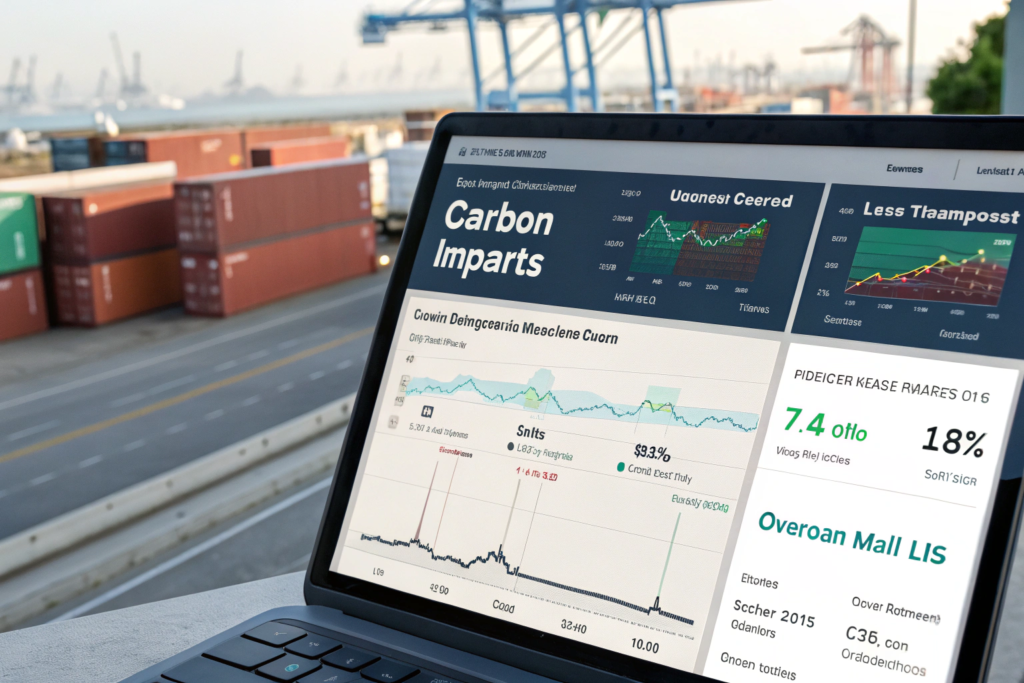
Our Carbon Emissions Report provides a shipment-specific, GLEC-aligned calculation of your freight emissions. The report includes the total CO2 equivalent emissions for the shipment, broken down by transport leg. It includes the emissions intensity in kg CO2e per unit shipped and per kg shipped. It includes the container utilization rate and the drayage mode. It compares the current shipment’s emissions against your historical baseline. The report is available in your portal within a week of delivery and can be downloaded as a PDF or exported as structured data for your ESG reporting system.
The report is designed for multiple audiences. The first page is an executive summary with the headline numbers and a trend chart. This is for your leadership team and your marketing department. The subsequent pages provide the detailed methodology, the input data, and the GLEC alignment statement. This is for your sustainability manager and your external auditor. The report meets the requirements of the GHG Protocol Corporate Value Chain Standard and the CDP supply chain reporting framework.
We also provide a quarterly summary that aggregates all your shipments. This summary shows your total freight emissions, your average intensity, your utilization trend, and your emissions reductions compared to baseline. This is the report you need for your quarterly ESG review and your annual sustainability report.
Can the Emissions Data Integrate with Your ESG Reporting Software?
You use an ESG reporting platform like Watershed, Persefoni, or Salesforce Net Zero Cloud. You manually enter freight emissions data into that platform. The manual entry is time-consuming and error-prone.
We provide an API that pushes your freight emissions data directly into your ESG reporting platform. The data is structured in the format expected by the platform, using the standard GLEC data fields. The integration eliminates manual data entry and ensures the data in your ESG platform is always current and aligned with your shipment records.
How Can You Use the Report to Make a Verified Green Claim?
You want to put a statement on your website: "We reduced our shipping emissions by 25% in 2026." Your marketing team asks if you have the data to back up the claim in case a customer or a regulator challenges it.
The quarterly summary report is your evidence. It shows your baseline emissions, your current emissions, and the calculated reduction percentage. It shows the methodology, the data sources, and the alignment with the GLEC Framework. If your claim is challenged, you can provide the report as verification. The report is designed to withstand scrutiny from informed stakeholders.
Conclusion
Eco-friendly freight forwarding in 2026 is not a certificate you buy at checkout. It is a set of operational decisions that physically reduce the amount of fuel burned to move your goods. It is load optimization that puts more product in the same container. It is carrier selection that favors efficient vessels. It is routing logic that defaults to rail over truck for long inland moves. It is electric drayage trucks moving containers off the ports. It is transparent, verifiable carbon accounting that shows the actual emissions, not just the offsets purchased.
At GeeseCargo, we made sustainability an operational discipline, not a marketing add-on. Our technology platform incorporates carbon metrics into every logistics decision. Our operations team executes the loading, the carrier booking, and the routing that produce real reductions. Our reporting gives you the data you need to tell your story honestly and credibly.
Offsets remain a tool for neutralizing the emissions that cannot yet be eliminated. They are the final step in the hierarchy, not the first. We help you reduce first, measure accurately, and offset what remains. This is the honest, effective, and credible approach to sustainable logistics.
If you want to start measuring and reducing your freight carbon footprint with real operational changes, go to GeeseCargo.com and request a sustainability consultation. Send me your recent shipment volumes and lanes, and I will show you your current estimated footprint and a roadmap for reducing it. Let’s make your supply chain cleaner in 2026, not just on paper, but in the physical world where it matters.