The global shipping slowdown isn’t over yet. In 2025, port congestion is making a strong comeback—especially at major EU and U.S. gateways. If your goods are arriving late or sitting longer at terminals, you’re not alone. Delays aren’t just inconvenient—they ripple across your entire supply chain.
On average, shippers should now budget 5–10 extra days of buffer time when routing through top European or U.S. ports in 2025.
This varies depending on port, season, and carrier performance—but the risk is real. Smart planning today means fewer late deliveries and emergency surcharges tomorrow.
Let’s break down where delays are hitting hardest, how much time to build into your calendar, and how GeeseCargo helps mitigate the risk for China-origin shipments bound for the West.
Where Are the Worst Port Delays in 2025?
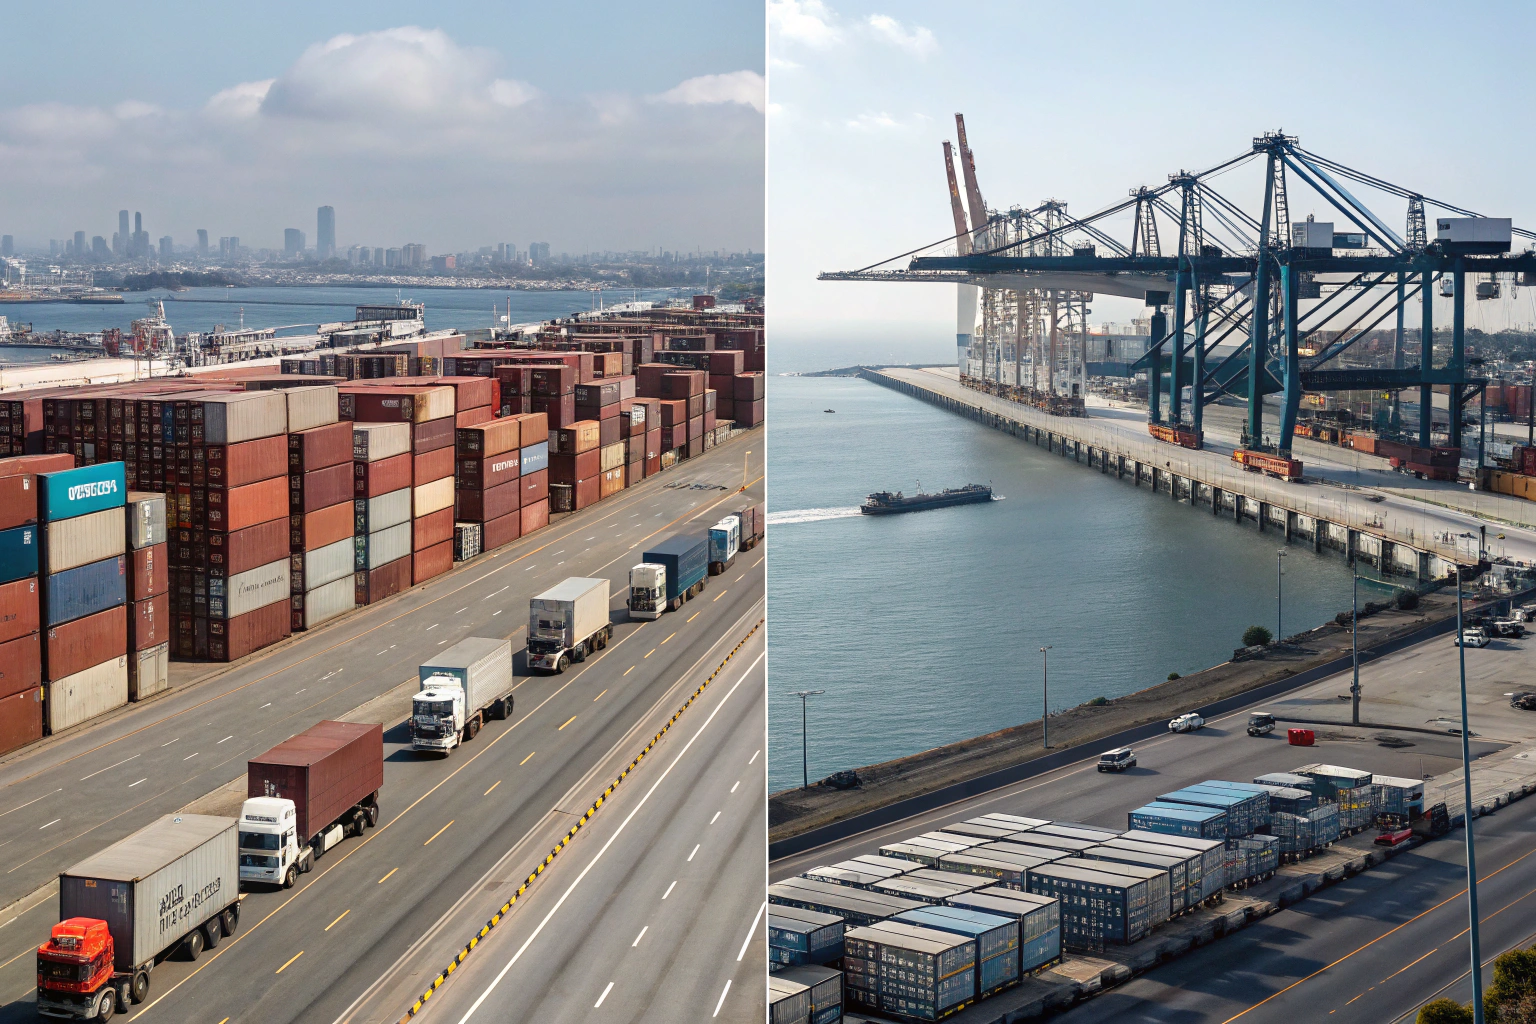
Which U.S. Ports Are Facing the Longest Delays?
The U.S. West Coast—especially LA and Long Beach—still struggles with chassis shortages, labor turnover, and dwell time inflation. In peak weeks, container dwell time reaches 7–10 days before truck-out.
The East Coast (Savannah, NY/NJ) has absorbed volume shifts from the West, but it’s now experiencing its own congestion cycles. Notably:
- NY/NJ: 4–6 day average delays
- Savannah: Vessel wait time of 3–5 days in June/July
- Houston: Delays worsened by Gulf weather patterns
Stay updated with the Port of LA dashboard and Port of NY/NJ terminal conditions.
What About Europe’s Busiest Terminals?
Northern European ports like Rotterdam, Antwerp, and Hamburg are plagued by strikes, labor shortages, and rail yard congestion. In 2025, many shippers are experiencing:
- Up to 6 days of vessel berthing delays
- Inland rail delays of 5–8 days to Germany and France
- Barge backlog issues on the Rhine and Elbe rivers
For Mediterranean hubs like Valencia or Gioia Tauro, the situation is more fluid—but transshipment delays still happen.
Monitor conditions at Hapag-Lloyd operational updates and Port of Rotterdam's status page.
How Much Buffer Time Should You Build into Your Schedule?

What’s the New Normal for Buffer Time?
In 2025, we recommend building in the following minimum buffer days after vessel ETA at major ports:
| Port | Suggested Buffer (Days) |
|---|---|
| LA/Long Beach | 8–10 |
| NY/NJ | 5–6 |
| Savannah | 5–7 |
| Rotterdam | 7–9 |
| Hamburg | 6–8 |
| Antwerp | 5–7 |
These buffers account for unloading delays, customs clearance, and drayage bottlenecks. If you’re running a just-in-time model, double these times during peak season (August–October).
Track dwell time metrics at FourKites port delays and MarineTraffic congestion heatmaps.
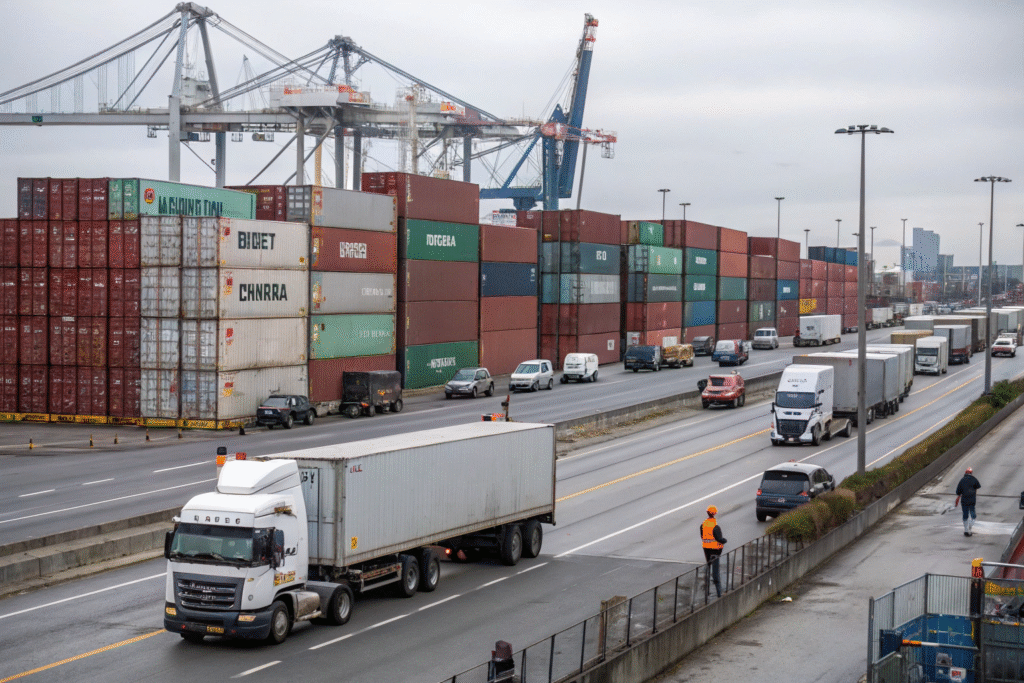
Are Rail and Truck Delays Adding Extra Days?
Yes. In Europe, inland rail to Germany and France now averages 3–5 days late. In the U.S., local drayage can be delayed by:
- Appointment system backlogs
- Limited driver availability
- Container pickup coordination gaps
As a rule, assume 3–4 extra days for final mile delivery once cargo leaves port—unless you’re using a reliable forwarder with in-yard priority access.
Compare inland trends via Xeneta’s land-side reports and JOC intermodal performance.
How Can You Minimize Disruption from Port Congestion?

Should You Consider Alternate Ports?
Yes. For both Europe and the U.S., consider:
- Seattle or Oakland as West Coast backups
- Norfolk or Charleston on the East Coast
- Zeebrugge or Le Havre in Europe if Northern hubs are full
At GeeseCargo, we regularly reroute shipments at origin based on weekly congestion data and offer split deliveries using transload hubs in less congested inland depots.
Explore dynamic routing tools at project44 or CargoSmart.
How Does Real-Time Visibility Help?
Tools like IoT trackers and digital freight dashboards allow you to:
- Spot congestion risks before arrival
- Pre-book customs clearance and delivery
- Communicate new ETAs to clients early
- Trigger last-mile replans without human bottlenecks
We use integrated visibility via Tive, Overhaul, and Freightos freight data to give clients daily status updates on Europe and U.S. port delays.
How Is GeeseCargo Helping Clients Build Smart Buffers?
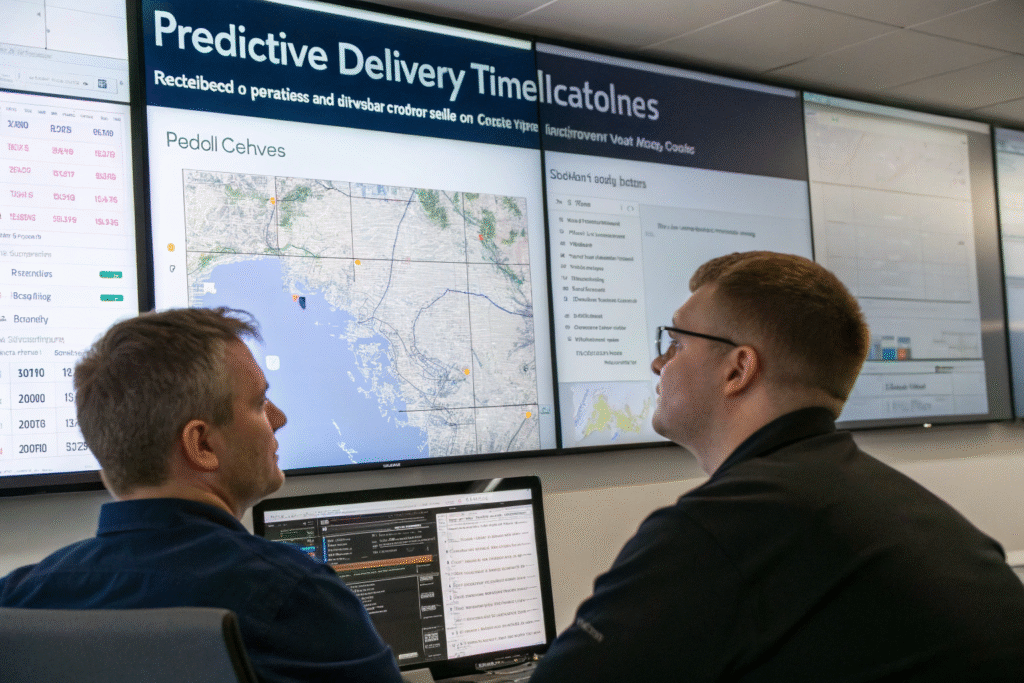
Do You Provide Dynamic ETA Adjustments?
Yes. Our platform constantly updates ETAs based on:
- Vessel arrival updates
- Port congestion levels
- Container availability
- Final-mile trucking capacity
This lets our clients adjust production, warehousing, and delivery timelines on the fly—rather than reacting last-minute.
Our dynamic timeline engine uses OpenTrack APIs and Sea-Intelligence’s delay models.
Can You Help Adjust Bookings Based on Forecast?
Absolutely. Each Monday, we generate port performance forecasts and offer:
- Rerouting suggestions
- Carrier-specific delay scores
- Peak season buffer recommendations
- Multi-port split delivery options
Our team helps your buyers make informed calls—not guesses.
See real tools like Flexport Delay Index and BlueX smart pricing for similar features.
Conclusion
Port delays in Europe and the U.S. are here to stay—for now. The smartest shippers in 2025 are no longer asking “if” a delay will happen—they’re planning when and how much. By building the right buffer time, using predictive visibility tools, and working with forwarders who adapt fast, you’ll stay ahead of congestion and keep your goods moving. At GeeseCargo, we make the port delay problem predictable—and solvable.