Your customers are asking questions they never asked five years ago. "What is the carbon footprint of this product?" "How do you ship it?" "Is your supply chain sustainable?" You do not have a good answer. You know your goods travel 7,500 miles from a factory in China to a warehouse in Dallas. You know that journey burns fossil fuel. But you do not know how much. You do not know if there is a better way. And you are worried that "doing the right thing" for the environment will mean "doing the expensive thing" for your margin.
At GeeseCargo, we help you reduce your shipping carbon footprint without sacrificing cost efficiency. We do this through four integrated strategies. First, our load optimization AI maximizes container utilization, reducing the CO2 per unit shipped. Second, our carrier selection algorithm prioritizes vessels with higher energy efficiency ratings when cost and transit time are comparable. Third, our route optimization engine selects the lowest-emission multimodal path for each shipment. Fourth, we provide you with a verifiable carbon emissions report for every shipment, so you can share your progress with your customers and stakeholders. Sustainability is not an add-on. It is built into our logistics decision-making.
Reducing carbon emissions in freight is not just about buying carbon offsets. Offsets have a role, but the real impact comes from burning less fuel. Burning less fuel comes from making smarter logistics decisions. Smarter logistics decisions come from having better data and better tools. This is where technology and sustainability intersect. Our AI platform makes the efficiency decisions that also happen to be the lower-emission decisions. Let me show you exactly how we do it and how you can communicate your progress to your market.
How Does Load Optimization Reduce Emissions Per Unit Shipped?
Your factory loads a 40-foot container until it looks full. The workers close the doors. The container ships. You later discover the container was only 82% utilized by volume. You shipped 18% air. That 18% of the container’s voyage was dead weight from an emissions perspective. You paid for fuel to move empty space.
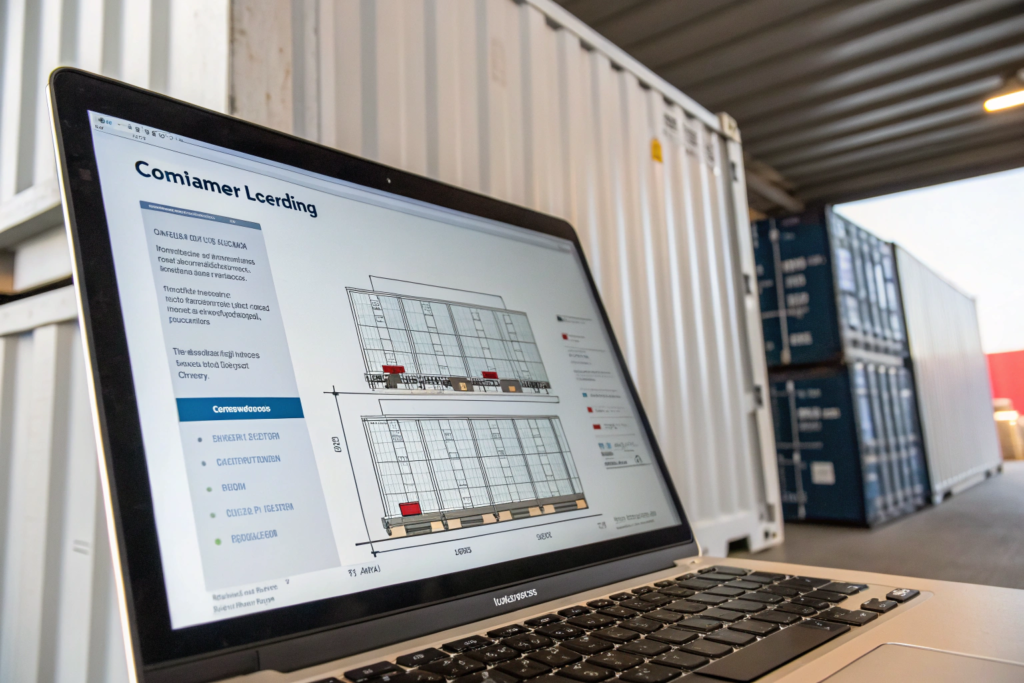
Our AI load planning software generates a container loading diagram that maximizes cubic utilization. The software uses 3D bin-packing algorithms to calculate the precise arrangement of your cartons that achieves the highest possible fill rate. Higher utilization means you ship more product in the same container. Shipping more product in the same container means fewer containers overall for the same total volume. Fewer containers mean less fuel burned and lower CO2 emissions per unit sold. An improvement from 82% to 95% utilization reduces your per-unit carbon footprint by approximately 14%.
The connection between container utilization and carbon emissions is direct and measurable. A container ship burns a massive amount of fuel to cross the Pacific Ocean. That fuel consumption is relatively fixed whether the container is 100% full or 80% full. The difference in total weight between a fully loaded and partially loaded container is small relative to the total weight of the vessel. The emissions are essentially the same. But the number of units inside the container determines how those emissions are allocated. If you fit 1,000 units in a container, each unit bears 1/1000th of the voyage’s emissions. If you fit 820 units, each unit bears 1/820th, which is about 22% more emissions per unit.
Our load optimization software targets a utilization rate of 92% or higher. We input the exact carton dimensions for every SKU in your shipment. The software tests thousands of stacking permutations. It considers carton crush strength so heavy cartons go on the bottom and light cartons on top. It considers accessibility so the warehouse can unload efficiently. The output is a visual load plan that our warehouse team follows precisely. The result is not just a lower freight cost per unit. It is a lower carbon footprint per unit. Cost efficiency and carbon efficiency are aligned. This is not a trade-off. It is a win-win.
We also apply this optimization logic to consolidation. When you have multiple small LCL shipments, we consolidate them into a full container rather than shipping them separately in shared containers that may not be optimized. A well-consolidated FCL is almost always more carbon-efficient per unit than multiple LCL shipments. We run the utilization numbers and show you the emissions impact alongside the cost impact.
How Does Carton Right-Sizing Contribute to Emissions Reduction?
Your supplier uses a standard carton that is 20% larger than your product requires. The extra space is filled with crumpled paper. You are shipping air and paper across the ocean. The dimensional weight and the physical volume both increase your freight cost and your carbon footprint.
We work with your supplier to right-size the carton. Our team measures your actual product and gift box dimensions and specifies a carton that fits with minimal void space. A 15% reduction in carton volume means 15% more units per container. The emissions per unit drop proportionally. The cost per unit drops proportionally. We provide the carton specification to the supplier. The cost of a new carton die is often recovered in a single shipment through freight savings alone.
What About the Emissions Impact of Consolidation Decisions?
You currently ship two separate LCL shipments from two different suppliers. Both are 6 cubic meters. Both travel in different containers on different vessels. The total emissions are two separate container voyages, each carrying your goods as a small fraction of the total load.
We consolidate both supplier loads at our Shenzhen warehouse into one 12-cubic-meter LCL block that ships in a single container. Or, if you add a third supplier’s load, we reach 15 cubic meters and ship a dedicated FCL. The consolidation reduces the total number of container movements associated with your goods. Fewer container movements mean lower total emissions allocated to your products. This is a logistics efficiency that translates directly into carbon efficiency.
How Do We Select Lower-Emission Ocean and Air Carriers?
You assume all container ships are the same. A ship is a ship. But the difference in fuel efficiency between the most efficient and least efficient container vessel on the same route can be 40% or more. The carrier you choose has a significant impact on your shipment’s carbon footprint.
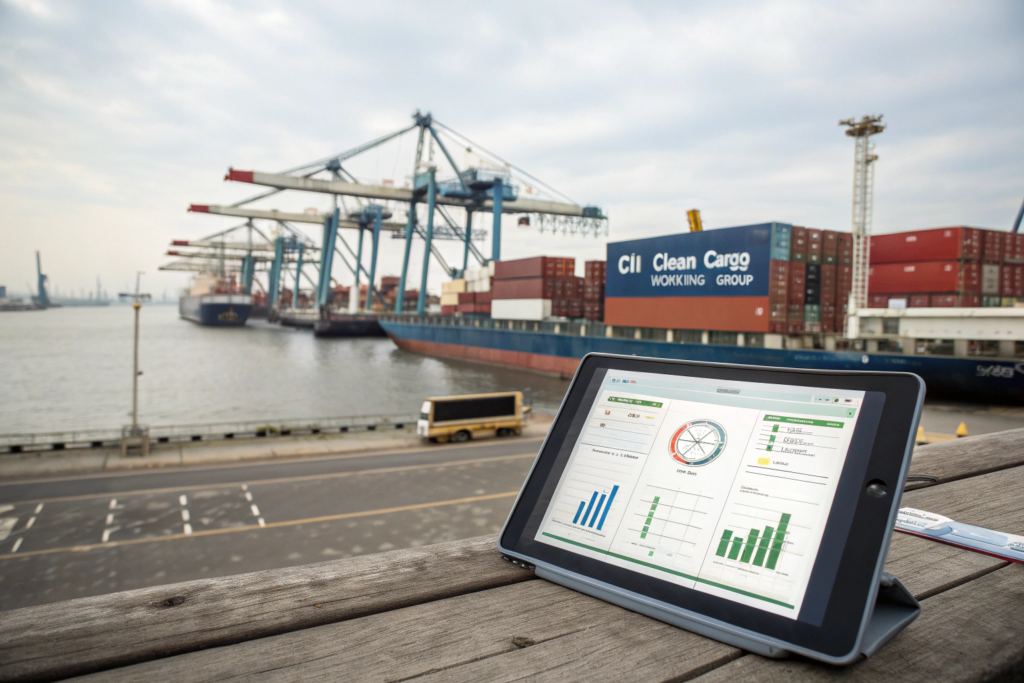
Our carrier selection algorithm includes an emissions efficiency score alongside cost and transit time. We use the International Maritime Organization’s Carbon Intensity Indicator (CII) ratings and the Clean Cargo Working Group’s emissions factors to evaluate carriers. When two carriers offer comparable cost and transit time for the same route, our system automatically selects the carrier with the higher environmental performance rating. You do not pay a green premium. You get the more efficient carrier at a competitive rate.
The IMO’s CII rating system assigns vessels a grade from A to E based on their CO2 emissions per ton-mile. A-rated vessels are the most efficient. E-rated vessels are the least efficient and face regulatory pressure to improve. Many freight forwarders ignore these ratings entirely. They select carriers based on the lowest cost or the closest personal relationship. Our system considers the rating as a weighted factor.
For air freight, a similar dynamic exists. Modern cargo aircraft like the Boeing 777F and Airbus A350F burn significantly less fuel per ton-kilometer than older aircraft like the 747-400F. Our air freight routing preferences newer, more fuel-efficient aircraft when available on the requested route. The emissions difference between a 777F and a 747-400F on a transpacific flight is approximately 20% per ton-kilometer.
We also factor in the carrier’s broader environmental commitments. Carriers investing in LNG-powered vessels, methanol-ready ships, or ammonia-ready newbuilds receive a higher long-term sustainability score in our system. We believe that supporting carriers making genuine green investments sends a market signal that efficiency matters.
What Are IMO CII Ratings, and How Do We Use Them?
You hear "IMO CII" and think it is another indecipherable industry acronym. It is actually a simple rating system that tells you how efficiently a ship burns fuel relative to its size and the distance it travels.
The IMO Carbon Intensity Indicator measures the grams of CO2 emitted per deadweight ton per nautical mile. The rating is A, B, C, D, or E. Vessels rated D or E must submit a corrective action plan. Vessels rated A or B are the top performers. Our operations team accesses the CII ratings for the vessels in our carrier partners’ fleets. When we book your container, we see which vessel it will be loaded onto. If a choice exists between two vessels on similar schedules, we select the higher-rated vessel. This is a behind-the-scenes decision that you do not need to request. It is part of our standard operating procedure for environmentally responsible freight management.
Does Green Carrier Selection Cost More?
You are willing to consider a lower-emission carrier, but your budget is tight. You cannot pay a 15% premium for a "green" shipping option. Your customers care about sustainability, but not enough to pay significantly more for your product.
Our algorithm selects the lower-emission carrier only when the cost and transit time are comparable to the alternatives. We do not book a carrier that is significantly more expensive or significantly slower just for the emissions rating. The filter is applied within a competitive band. If the most efficient carrier is also the most expensive, it will not be selected. If the second most efficient carrier is within 5% of the cheapest carrier’s rate, it will be selected. This approach ensures you benefit from emissions reductions without a cost penalty. The efficiency gains that reduce emissions also tend to reduce fuel consumption, which over time translates into competitive pricing.
How Does Multimodal Route Optimization Lower Your Carbon Footprint?
Your shipment from Shenzhen to Chicago defaults to ocean to Los Angeles, then truck to Chicago. This is the most common route. But is it the lowest-emission route? The answer depends on the specific circumstances of your shipment. The default route is not always the optimal route.
Our route optimization engine evaluates all viable multimodal paths for your shipment. Ocean to LA plus truck to Chicago. Ocean to LA plus rail intermodal to Chicago. Ocean to Prince Rupert in Canada plus rail to Chicago. For each path, the engine calculates the total transit time, the total cost, and the estimated total CO2 emissions. Rail intermodal typically produces 60% to 70% less emissions per ton-mile than long-haul trucking. If the rail option meets your timeline and budget, we recommend it as the lower-emission choice.
The emissions difference between truck and rail is significant. A gallon of diesel moves one ton of freight approximately 130 miles by truck. That same gallon moves one ton approximately 480 miles by rail. The physics of steel wheels on steel rails creates dramatically less rolling resistance than rubber tires on asphalt. For the inland leg of a China-to-Chicago shipment, routing through the Pacific Northwest and using rail for the inland portion can reduce the total door-to-door carbon footprint by 15% to 20% compared to the LA trucking route.
Our platform calculates these emissions estimates for each routing option. The data is presented to you alongside the cost and transit time. You make the final decision. We have found that when presented with clear data, many importers choose the lower-emission routing if the cost and time differences are modest. The data makes the choice easy.

How Does Rail Intermodal Compare to Trucking for Emissions?
You need to get your container from the port to your warehouse 800 miles inland. The trucking option is direct and familiar. The rail option sounds more complicated. You do not know the emissions trade-off.
Trucking: A diesel truck carrying one 40-foot container burns approximately 1 gallon of diesel every 6 miles. Over 800 miles, that is approximately 133 gallons of diesel, producing roughly 1.35 metric tons of CO2. Rail: An intermodal train carrying hundreds of containers burns approximately 1 gallon of diesel to move one container 480 miles. Over 800 miles, that is approximately 1.7 gallons of diesel allocated to your container, producing roughly 0.017 metric tons of CO2. The rail option reduces the inland emissions by over 95%. The total door-to-door reduction is lower because the ocean leg is the dominant source of emissions, but the rail routing still produces a meaningful total reduction.
What About Nearshoring or Multi-Country Sourcing?
You are open to reducing your carbon footprint by shifting some production closer to your market. But you do not know how to evaluate the emissions impact of sourcing from China versus Mexico or Turkey.
Our platform can calculate the comparative carbon footprint of different sourcing scenarios. Shipment from Shanghai to Los Angeles by ocean. Shipment from Mexico City to Dallas by truck. Shipment from Istanbul to New York by ocean. The platform uses standard emissions factors for each mode and each lane. We can provide a comparative analysis that helps you make sourcing decisions with emissions data alongside cost and lead time data. This is strategic supply chain consulting enabled by our technology platform.
How Do We Calculate and Report Your Shipment Carbon Footprint?
You want to tell your customers that you are reducing your carbon footprint. But you need a number. A credible, verifiable number that can withstand scrutiny. You cannot just say "we are greener." You need to say "our shipping emissions per unit decreased by 18% this year, verified by our logistics partner GeeseCargo."
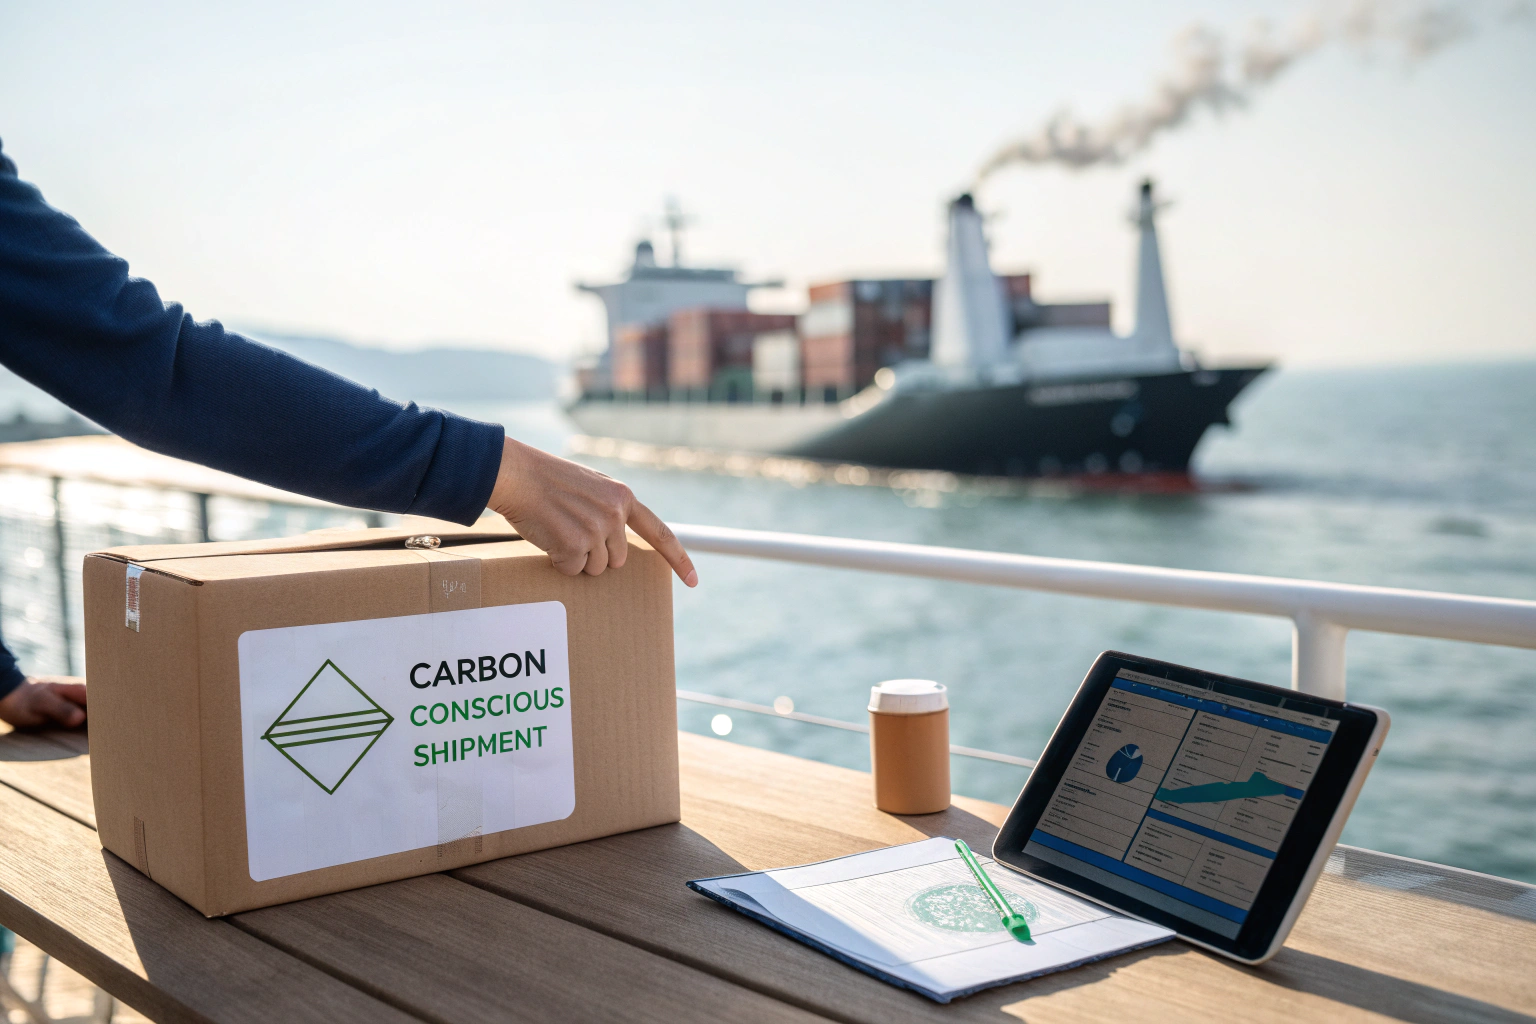
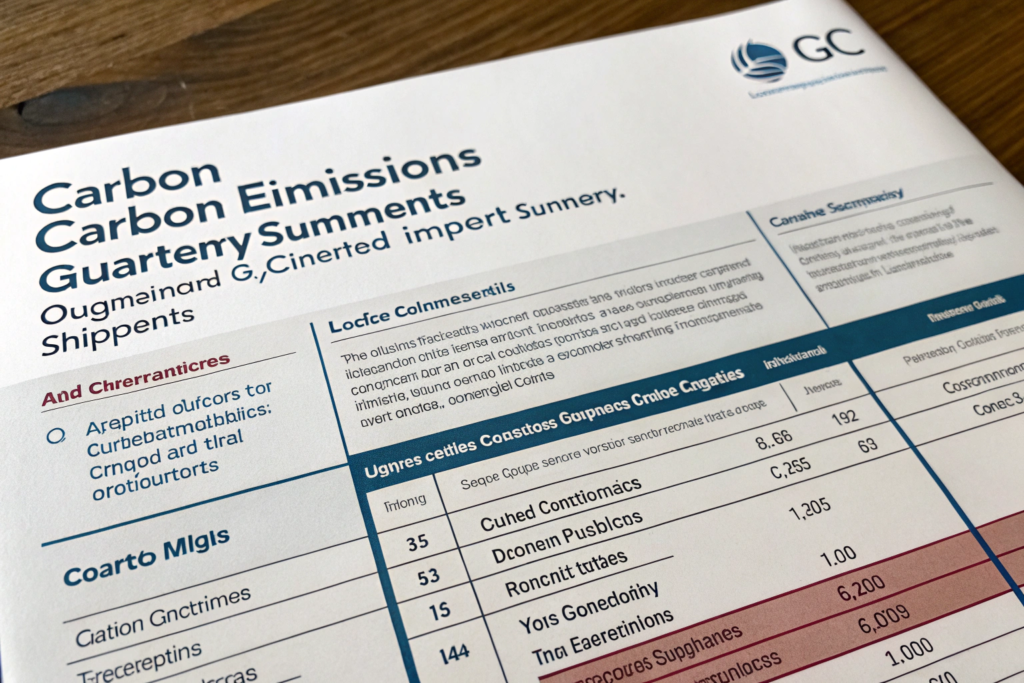
We provide a Carbon Emissions Report for every shipment and a quarterly summary for your entire import program. The report uses the Global Logistics Emissions Council (GLEC) framework, the recognized industry standard for logistics carbon accounting. The report shows the total CO2 equivalent emissions for the shipment, broken down by leg: origin trucking, ocean transit, destination drayage, and inland delivery. It also shows the emissions per unit shipped and per kilogram shipped. This data gives you the verified metrics you need for your sustainability reporting, your customer communications, and your ESG disclosures.
The GLEC framework is the logistics industry’s equivalent of the GHG Protocol for corporate emissions. It standardizes how emissions are calculated across different modes of transport and different geographies. Using GLEC methodology means your emissions data is consistent, comparable, and auditable. If you report your supply chain emissions to CDP, to a sustainability rating agency, or to a retail partner, GLEC-aligned data is the standard they expect.
Our report breaks down the emissions into Scope 3, Category 4 (Upstream Transportation and Distribution) for your GHG inventory. The ocean leg emissions are calculated using the Clean Cargo Working Group’s trade lane emissions factors, which are the most accurate available for container shipping. The truck and rail legs are calculated using the EPA’s SmartWay program factors. The calculations account for the actual distance traveled, the actual weight of your shipment, and the actual mode and vessel type used. This is not a generic estimate based on average industry data. It is a shipment-specific calculation using primary data.
You receive the report in your client portal within a week of delivery. The report includes the absolute emissions, the intensity metrics, and a comparison to a baseline if you have established one. You can download the report as a PDF to share with stakeholders.
What Is the GLEC Framework, and Why Does It Matter?
You see "GLEC-aligned" and wonder if it is just another industry certification that does not mean anything. The GLEC Framework matters because it provides a single, harmonized methodology for logistics emissions accounting that is recognized globally.
Before the GLEC Framework, different forwarders and carriers calculated emissions using different methodologies. A ton-kilometer on a ship might be calculated one way by Maersk and a different way by CMA CGM. Comparison was impossible. The GLEC Framework, developed by the Smart Freight Centre and aligned with the GHG Protocol, created a single standard. It is endorsed by over 150 multinational corporations and is the basis for the ISO 14083 standard on logistics emissions. When we provide a GLEC-aligned report, you can confidently compare your emissions over time and against industry benchmarks.
How Can You Use the Emissions Data in Your Marketing?
You have the emissions report. You want to share your progress with your customers. You do not want to greenwash. You want to communicate honestly and credibly.
We recommend using specific, verified claims. "Our shipping carbon footprint per unit decreased by 18% in 2026, verified by our logistics partner GeeseCargo using the GLEC Framework." This is specific, verifiable, and credible. Avoid vague claims like "eco-friendly shipping" or "green logistics." Customers are increasingly sophisticated about greenwashing, and vague claims can damage trust. We provide you with the data and the methodology documentation to back up your specific claims. You can also display a carbon footprint label on your product page, showing the estimated shipping emissions for that product. We can provide the data feed to support this.
Conclusion
Reducing your carbon footprint when shipping from China is not about paying a green premium or buying offsets to salve your conscience. It is about making smarter logistics decisions. Smarter container loading puts more product in the same box and burns less fuel per unit. Smarter carrier selection favors more efficient vessels without costing more. Smarter routing chooses lower-emission paths when the schedule allows. Better data measures the results and lets you share your progress honestly.
At GeeseCargo, sustainability is integrated into our logistics operations, not bolted on as a separate "green" service. Our AI optimization tools, our carrier selection logic, and our routing engine all incorporate emissions as a decision factor alongside cost and time. The result is a shipping service that is simultaneously more cost-effective and lower-carbon. We do not force you to choose between your margin and your values.
The market is moving toward transparency. Your retail buyers, your e-commerce customers, and your investors are asking about supply chain emissions. Soon, they will not ask. They will expect the data. We give you that data, calculated to the GLEC standard, so you are ready for that future today.
If you want to understand your current shipping carbon footprint and see where you can reduce it without increasing your costs, go to GeeseCargo.com and request a carbon assessment. Send me your last three months of shipment data, and I will generate a baseline carbon report with specific, actionable recommendations for reduction. Sustainability is a journey. Let’s take the first step together.