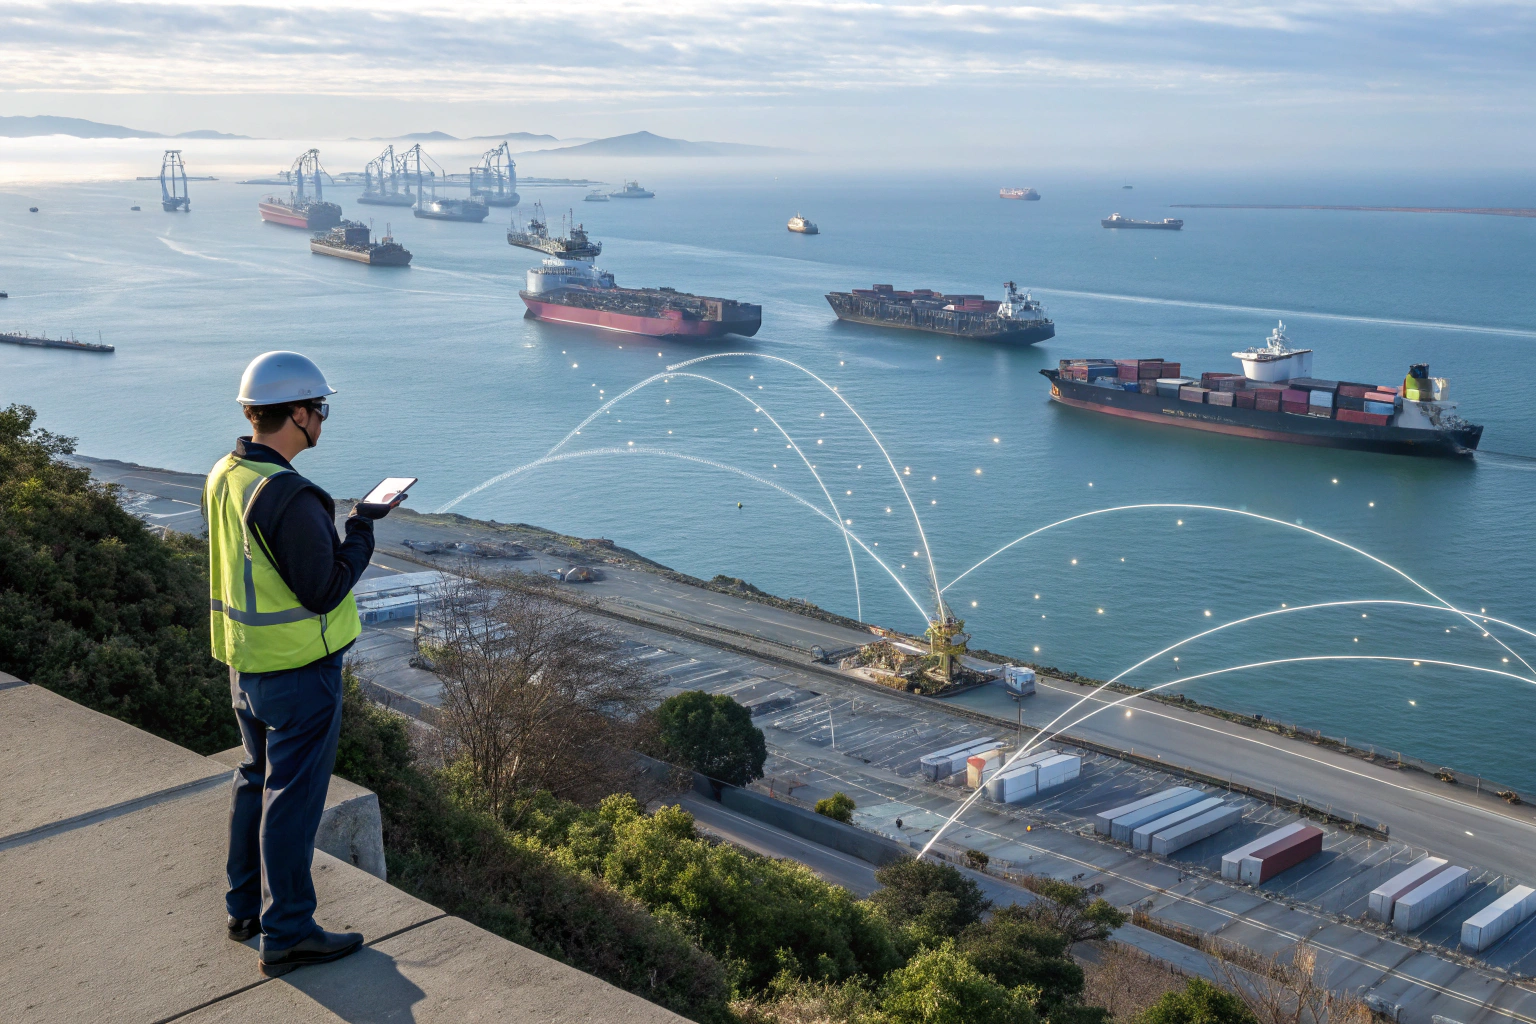
I watched the live satellite feed of the San Pedro Bay last November. Over 90 container ships were anchored. They looked like a floating city of steel. One of my clients had five containers on five different ships out there. He was losing $2,000 a day in detention and demurrage fees. He felt helpless. The cargo was physically there, just 10 miles from the dock, but he could not touch it. This is the modern reality of US port congestion. The port is not a pipe. It is a funnel. And sometimes that funnel gets completely blocked. You feel the pressure when your retail shelves are empty but your tracking screen shows "vessel at anchorage" for two weeks.
The US ports most affected by congestion right now are Los Angeles and Long Beach on the West Coast, and Savannah and New York/Newark on the East Coast. The primary causes are high import volumes, warehouse space shortages, and chassis imbalances. GeeseCargo protects your supply chain by actively rerouting cargo to less congested alternative ports like Oakland, Seattle, Houston, and Charleston, combined with a "port-to-door" express trucking solution that avoids the busiest container yards.
A port is like a highway. When the main road is jammed, you take the exit and use the side streets. You still reach your destination. It might take a slightly different time, but you keep moving. Standing still is the only unacceptable outcome. I want to walk you through the exact congestion hotspots across the US. I will explain why some ports are suffering more than others. Most importantly, I will give you our specific rerouting playbook. These are the exact alternative gateways we use to keep Ron’s clothing and accessories flowing without a day of unnecessary delay.
West Coast Port Congestion: Los Angeles and Long Beach
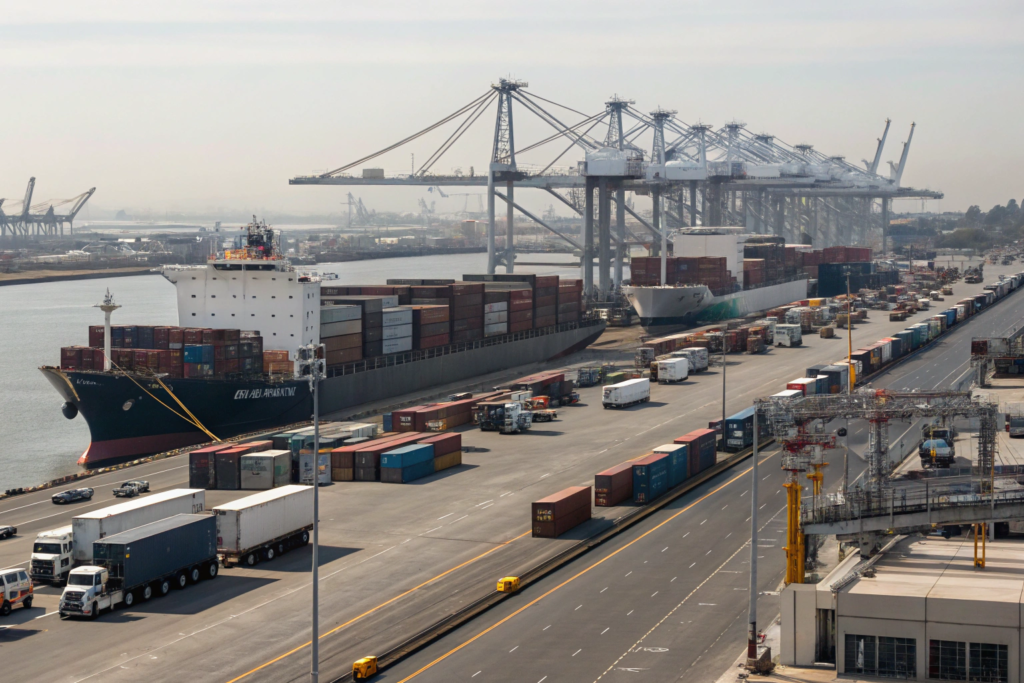
The twin ports of LA and Long Beach are the main entrance for your goods from China. They handle about 40% of all US container imports. This is where your container of summer dresses from Shanghai likely arrives. When these ports work, they are a miracle of efficiency. When they stumble, the entire US supply chain feels the pain. The queue of ships can stretch over the horizon. The yards fill up so completely that there is literally no space to stack another box. Chassis to mount the containers onto trucks become as rare as gold.
The LA/LB port complex regularly experiences congestion that adds 5 to 20 days of delay to a standard container delivery. The root causes are peak season volume surges, labor slowdowns during longshore contract negotiations, and a chronic chassis shortage that prevents truckers from picking up loaded containers. GeeseCargo monitors the Port Optimizer data daily and activates our Northern California reroute through Oakland when the LA anchorage count exceeds 20 vessels.
You cannot wish away a 20-ship queue. But you can decide not to join it. The decision to reroute must come before the ship leaves China. Once the vessel is headed for the San Pedro Bay, your fate is sealed with that anchorage. The smart play is to select a different discharge port at the booking stage. Let me explain the specific symptoms of an LA congestion crisis. And I want to show you exactly how we use the Port of Oakland as a pressure release valve. This strategy has saved my clients millions in late fees and lost sales.
What are the specific symptoms of a severe LA/LB congestion crisis?
The first symptom is the anchorage count. When you see more than 20 vessels waiting for a berth, you know the system is broken. Normal operations have zero to 5 ships at anchor. The second symptom is the container dwell time on the terminal. A healthy port keeps imports for less than 3 days before they are picked up by a truck. In a congestion crisis, this dwell time explodes to 10 or even 14 days. This means your box is physically there but buried under a mountain of other boxes. The crane operator cannot reach it.
The third symptom is the chassis situation. A container needs a chassis to leave the port. Chassis pools are shared. During a crunch, truckers wait in line for hours at a chassis yard only to find it empty. They have to go to a different yard. They lose a whole day. This is called a "dry run." You, the cargo owner, get charged for the trucker’s wasted time. The Port of Los Angeles signal metrics provide some of this data. We watch the "street dwell time" closely. If the average truck visit takes over 90 minutes, we know the port is failing.
A hidden symptom is the empty container return problem. When you finally unload the box at your warehouse, the truck must return the empty container to a specific terminal. If that terminal is full, the driver gets a rejection. The empty box sits on the back of the truck, using up the precious chassis. The truck cannot pick up a new loaded box. This creates a vicious circle. Empty containers clog the system. We track these symptoms through a combination of public terminal data and private insights from our drayage partners. When three of these four symptoms turn red, the port is essentially gridlocked for a standard importer. Our job is to never let your cargo enter a gridlocked system. We must make the choice before the vessel’s estimated time of departure from China. Our congestion monitoring system gives us a 10-day warning window. We use that window to protect your freight.
How does rerouting from LA to Oakland save time despite the longer ocean voyage?
The voyage from Shanghai to Oakland is roughly 2 days longer than the voyage to Los Angeles. On paper, this looks like a loss. You are trading a 14-day transit for a 16-day transit. But paper is not reality. The reality is that the LA/LB box is going to sit at anchor for 7 days. So the true LA time is 14 plus 7, which is 21 days. The Oakland time is just 16 days. The math is simple. You save 5 days by choosing the longer route to a faster port. This is the "avoidance dividend."
Oakland is a major port with deep water. It is a gateway to the same California market. It has its own dedicated rail connections to the Midwest and the East Coast via the Union Pacific Railroad. It is less prone to the extreme volume spikes that cripple LA/LB because it is not the first port of call on the big alliance loops. The terminal layout in Oakland is also more manageable. The four marine terminals compete for business, which keeps them efficient. The truck turn times at the Oakland International Container Terminal are consistently faster than the largest LA terminals.
We use this Port of Oakland strategy specifically for Northern California deliveries and for Midwest intermodal cargo. We disembark the container in Oakland. We clear customs immediately. The container is loaded onto a train at the near-dock rail yard. It heads to Chicago or Memphis without ever touching the Los Angeles trucking grid. The total port-to-door time is dramatically shorter. We also have a close relationship with a bonded trucking company in Oakland. They do not suffer from the same chassis shortages because the demand pressure is lower. The chassis pool is better balanced. This operational reliability is what we sell. You do not just get a vessel route. You get a total port ecosystem that functions. We are constantly comparing the real-time "total penalty time" of LA against the "extra steaming time" to Oakland. When the penalty time is bigger, we switch. It is a data-driven decision, not a guess. This is how we keep our promise of a reliable delivery window even when the biggest port in America is drowning in cargo.
East Coast and Gulf Coast Congestion Hotspots
The West Coast is the famous bottleneck. But the East Coast has quietly become a trouble spot. After the pandemic, many importers "just in case" shifted their supply chains away from LA. They flooded the ports of Savannah and New York with cargo. These ports were not designed for the sudden massive surge. The result is a new kind of congestion. The ports are physically smaller. The channels are narrower. The rail connections are less extensive. When they get clogged, it takes longer to fix.
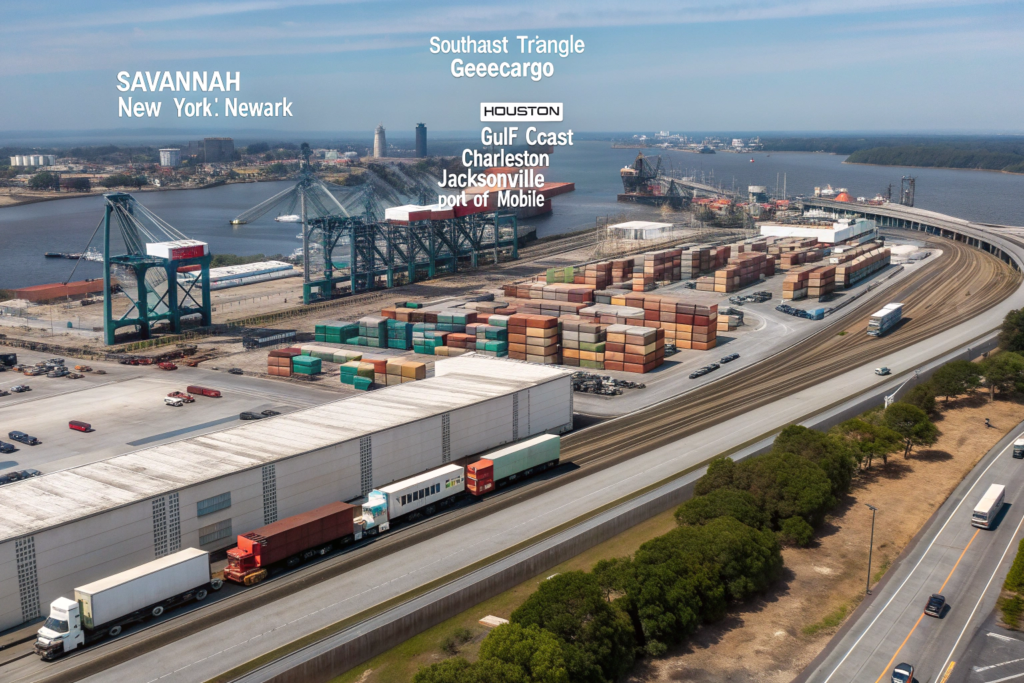
Savannah and New York/Newark are the primary East Coast congestion zones. Houston is the Gulf Coast hotspot. Savannah suffers from warehouse overflow and limited rail capacity. New York struggles with terminal density and trucking delays. GeeseCargo alleviates East Coast congestion by using the "Southeast Triangle" strategy, moving discharge to Charleston or Jacksonville, and routing Gulf-bound cargo through the agile Port of Mobile instead of the congested Houston terminal complex.
Diversification is not just a West Coast game. You might have a plan to ship everything to Savannah because your distribution center is in Atlanta. That makes geographic sense. But if the container yard in Savannah is 90% utilized, that smart geographic choice becomes a trap. The container becomes liquid inventory you cannot access. We must look at the broader region. The Southeast US has multiple water ports. We can use them creatively. Let’s analyze the specific problems in Savannah and New York. Then I will lay out the Triangle Strategy that offers you a fast, flexible alternative.
Why is Savannah experiencing persistent delays and how does the Charleston alternative work?
Savannah is a powerhouse. It has massive on-dock rail. It attracts huge volumes of retail goods. But its geography is its weakness. The port is located up the Savannah River. The channel is constrained by a tidal window. The largest neo-Panamax vessels can only transit the river at high tide. If a vessel misses the tide window, it waits 12 hours for the next one. This creates a cascading schedule delay. The terminal itself, the Garden City Terminal, is vast. But the sheer volume of imports means container dwell times have regularly spiked to 7 or 8 days. The terminal cannot push the containers out to inland warehouses fast enough.
Charleston is just 100 miles up the coast. It has a major advantage. The Charleston Harbor is a natural deep-water port. The channel is deeper and wider. Vessels do not wait for tides. The Hugh K. Leatherman Terminal in Charleston is a brand-new, state-of-the-art facility. It is designed with extensive automation and a high-capacity truck gate. It has excess capacity. We use the South Carolina Ports Authority terminal as our default alternative when Savannah hits a snag.
The switch is operationally smooth. The trucking distance from Charleston to an Atlanta distribution center is roughly the same as from Savannah. You gain a faster port discharge without sacrificing the inland delivery time. The Norfolk Southern rail service from Charleston is robust. We can route the container to the same inland rail ramps. For you, the process is invisible. The bill of lading simply shows a different discharge port. The transit time might even be faster because you skip the Savannah tidal delay. We call this the "Charleston release valve." It works because we have contracts with the same steamship lines that call both ports. We request a port of discharge change while the ship is still in the ocean. There is a small amendment fee. But the savings from avoiding a week of Savannah waiting time more than cover that fee. Our Southeast port routing flexibility means your Atlanta-shelf restock plan stays on schedule.
What Gulf Coast port offers the most agile alternative to congested Houston?
Houston is a giant port. It serves the massive Texas market. But Houston has a problem with space and complexity. The Bayport and Barbours Cut terminals are often clogged with import containers. The truck turn times can be brutal because of the heavy mix of petrochemical and construction equipment cargo. Your container of gifts can get stuck behind massive oil pipes being slowly loaded. The port is also prone to fog closures in the winter months. The Houston Ship Channel shuts down in heavy fog. A 3-day fog event creates a 5-day backlog.
For a more agile entry into the Gulf region, we use the Port of Mobile in Alabama. Mobile is a rising star. It is a smaller, more manageable port with a deep channel. It is not affected by the industrial cargo congestion of Houston. The container terminal, APM Terminals Mobile, is modern and highly automated. The port has excellent connections to the five Class I railroads, including direct CSX and Norfolk Southern service. You can reach Dallas, Houston, and even Memphis from Mobile with very efficient rail transit times.
We often use Mobile as a deliberate choice for cargo destined for the Central US and even for Texas customers. The ocean transit time from China to Mobile via the Suez Canal or the Panama Canal is roughly on par with Houston. The real win is the terminal fluidity. Your container is discharged and placed on a railcar within 2 days. A container arriving in Houston might wait 6 days for the same rail connection because of yard congestion. We work with the Alabama State Port Authority to secure smooth intermodal handoffs. This strategy is a perfect example of using a niche port to gain a speed advantage. You bypass the obvious mega-port and use a high-performance secondary port. Your customer in Austin does not care if the container came through Houston or Mobile. They care that it arrives on time. By choosing Mobile, we make that happen. It is a deliberate, proactive choice that keeps your supply chain ahead of the congestion curve.
GeeseCargo’s Proactive Rerouting Strategy and Technology
Rerouting is not a panic button. It is a planned protocol. We do not wake up on Monday, see a news alert about a port closure, and then scramble. We operate on a Pre-Arrival Assessment model. Before your container is even loaded onto the truck in China, we have already run a simulation of the destination port conditions for the estimated arrival week. We use a mix of public data and private carrier intelligence. We know the vessel schedule density. We know the available labor hours. We predict the bottleneck probability.
GeeseCargo’s proactive rerouting system combines three layers. First, a predictive engine that analyzes port congestion risk 14 days before vessel arrival. Second, a pre-negotiated alternative port network that allows us to switch discharge ports with a single email to the carrier. Third, a dedicated "surge capacity" truck and rail network that springs into action when a port switch is activated, ensuring the inland delivery timeline remains intact.
Technology is the scanner. Human judgment is the decision-maker. The system tells me that LA has a 75% chance of a 4-day delay. I then call the carrier. I use our contract leverage to amend the discharge port. This is not a call any forwarder can make. It requires a relationship of trust and volume with the steamship line. We have both. Let me pull back the curtain on the data layer that powers these predictions. And I want to show you the human infrastructure we have built with trucking and rail companies to absorb the sudden change in plan. You need both silicon and muscle.
How does our predictive engine forecast port delays before they happen?
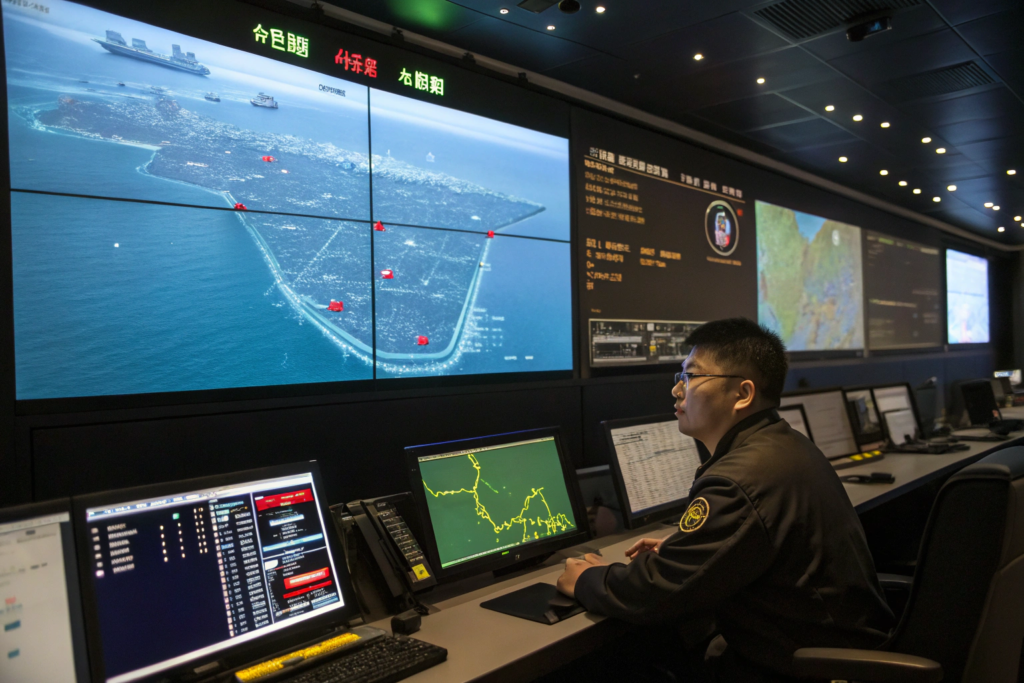
Our predictive model does not just look at one number. It aggregates a basket of indicators. We pull the live automatic identification system ship positions to count vessels heading to a specific port. We pull the terminal utilization reports from port authority websites. We pull the average truck turn time data from our drayage partners’ GPS logs. We also scan unstructured data, such as local news reports about union negotiations or weather service fog advisories. All this data feeds into a dashboard.
The engine assigns a "Congestion Severity Index" score from 1 to 10 for each major US port for the next three weeks. A score of 8 means a very high probability of a delay exceeding 5 days. When your booking is made, we input the vessel, the estimated arrival date, and the destination. The system instantly returns a risk score for that specific voyage. If the score is above a threshold, we trigger a manual review. A human team member, often me, looks at the data. We decide whether to maintain the routing or activate an alternative port strategy.
The engine also learns from history. It knows that Savannah gets backed up every August before the school season. It knows that LA suffers in June when the labor contract expires. It applies a seasonal weight. This is not a generic prediction. It is tailored to the rhythm of your supply chain. We show you this data if you want to see it. We can tell you, "The risk for your November 15th arrival in LA is high. We recommend a shift to Seattle with intermodal rail to the final destination." This is a collaborative decision. But we make the recommendation early enough that the change costs are minimal. Early intervention is the key to cheap, effective rerouting. Our port delay prediction system takes the guesswork out of your logistics. It turns uncertain ocean shipping into a managed risk.
What pre-arranged trucking and rail capacity supports our sudden port-of-discharge changes?
Switching the port is only half the battle. The container still needs to get from the new, unexpected port to your warehouse. If we change from Savannah to Charleston, we need a truck ready in Charleston, not Savannah. If we do not have that capacity secured immediately, the container just sits in the new port. You trade one delay for another. We solved this through a "Flex Capacity Network."
We have pre-negotiated annual contracts with regional trucking companies in every major alternative port. In the Gulf, we have a guaranteed capacity of 10 power-only units per day in Mobile. In the Southeast, we have a dedicated fleet of 15 trucks available on 24-hour notice in Charleston. These are not spot market trucks. They are under a service level agreement. They are committed to us. We pay a small monthly standby fee for this priority access. When we make a discharge port switch, we activate this capacity. The trucker receives the container release information instantly. They are at the terminal within hours of the vessel discharge.
For inland rail moves, the process is equally streamlined. We have contracted rates and space commitments with the major rail carriers through their intermodal marketing company partners. We do not need to go to the spot rail market. We use our direct rail partnerships to book the container onto the next available train. The switch is data-driven. The container number is transmitted from the steamship line to the railroad. The billing is updated automatically. We monitor the railcar’s progress across the country. This Flex Capacity Network is the physical manifestation of our rerouting intelligence. The computer says "switch to Mobile." The human dispatcher clicks "activate Mobile drayage contract." The truck moves. The container is delivered. You see no gap. You see no delay. You just see a tracking update that says "out for delivery" from a new city. This is the seamless execution that defines our professional, reliable service. It is a promise kept, regardless of which port the box came through.
Conclusion
The US port system is under constant stress. Los Angeles and Long Beach are the epicenter of West Coast delays. Savannah and New York are the congested arteries of the East Coast. Houston is the choked Gulf gateway. But a port problem is not your problem. It is our problem to solve. We have built a system that refuses to accept port congestion as an excuse. We use the Port Optimizer data to spot the LA gridlock. We shift your cargo to Oakland and save you five days. We use the tidal data and terminal statistics to predict the Savannah slowdown. We shift your cargo to Charleston and keep your Atlanta delivery on time. We use the fog and yard data to avoid Houston, shifting your cargo to the agile Port of Mobile.
This is not a manual guessing game. It is a technology-driven strategy. Our predictive engine scans the horizon for you. It gives us a 14-day warning. We combine that warning with our pre-arranged Flex Capacity Network. The trucks are ready. The rail cars are booked. The switch is a single click in our system. You do not pay detention. You do not pay demurrage. You do not lose the sales season. You just receive your goods.
I want you to stop looking at the port with anxiety. Let us handle the port for you. We have the years of experience on the US routes. We know the officials at the major and minor ports. We know the alternative gateways that the big conglomerates ignore. We offer you a logistics service that is not just competitive in price, but resilient in execution. Contact our team at GeeseCargo today. Share your next shipment route and your delivery deadline. We will run a congestion risk assessment for free. We will show you the safe path while others get stuck in the queue. Let’s build a reliable supply chain together.