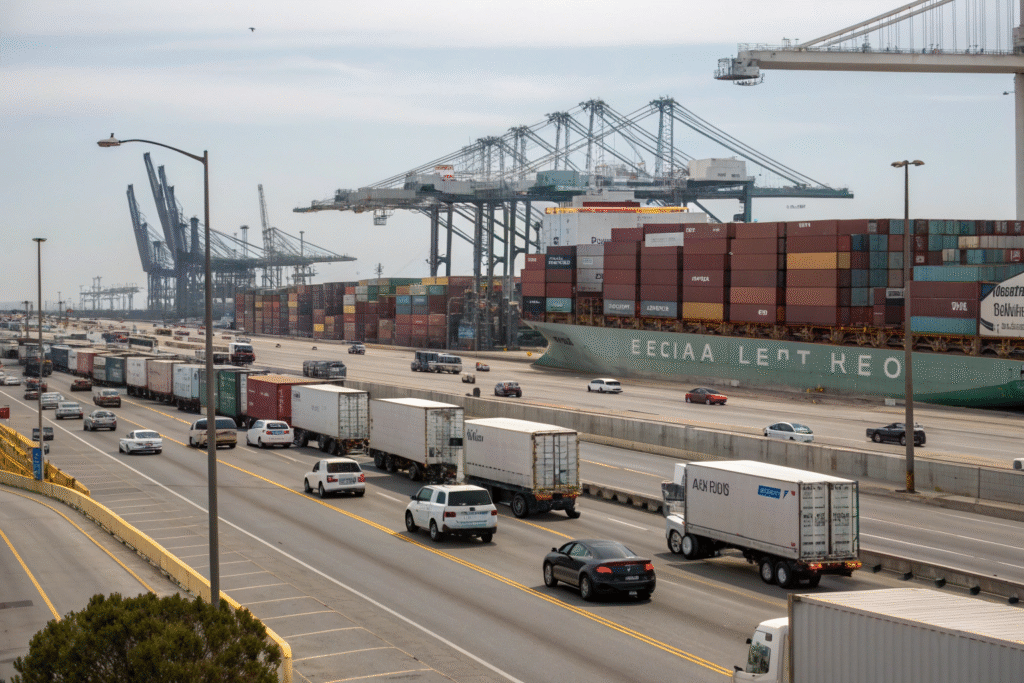
When demand spikes across China–U.S.–Europe lanes, the weakest link is capacity. Retailers and brands accelerate POs, factories finish runs days early, and ports absorb sudden volume surges. In July 2025, the Port of Los Angeles moved 1.0M+ TEUs in a single month—a new all-time record—while imports into the LA/LB gateway topped 1,011,809 TEUs combined. Those numbers show why a forwarder’s scale and discipline matter when every hour of dwell time creates cost.
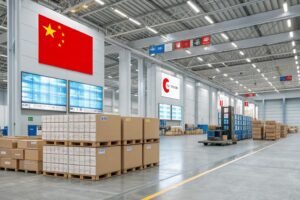
At GeeseCargo, we absorb high-volume shocks with four levers: secured capacity blocks, dynamic routing across ocean/air/rail, cross-docking to cut dwell by a full day, and predictive planning that pre-books slots weeks ahead of known surges. We prove it with concrete outcomes tied to public lane data and port throughput each quarter.
Shippers needed certainty in Q3 2025 as rates zig-zagged. Spot prices on Asia→U.S. lanes fell hard mid-summer, while weekly booking waves surged ahead of tariff milestones. Our operating playbook prioritized consolidation and alternative routings so clients didn’t chase the market; they shipped on schedule.
How Do We Secure Capacity During Peak Weeks?
Sales events, tariff deadlines, and seasonal drops create 72-hour rush windows. In August 2025, forwarders reported pre-deadline import waves that pushed LA/LB utilization to record levels, with LA alone processing 543,728 loaded import TEUs in July (+8% YoY). This backdrop is why our first lever is guaranteed space with ocean carriers and key air gateways, reinforced by consolidation so smaller orders ride on major lanes as full boxes.
We ring-fence space and combine orders into FCL so unit costs stay predictable when spot markets swing. During late-August repricing, we mapped clients to capacity that remained stable while FBX West Coast levels hovered near ~$1,900/FEU (W33), and we shifted urgent SKUs to priority air when China→N. America air averages hit ~$5.57/kg.
How do we lock space before a spike?
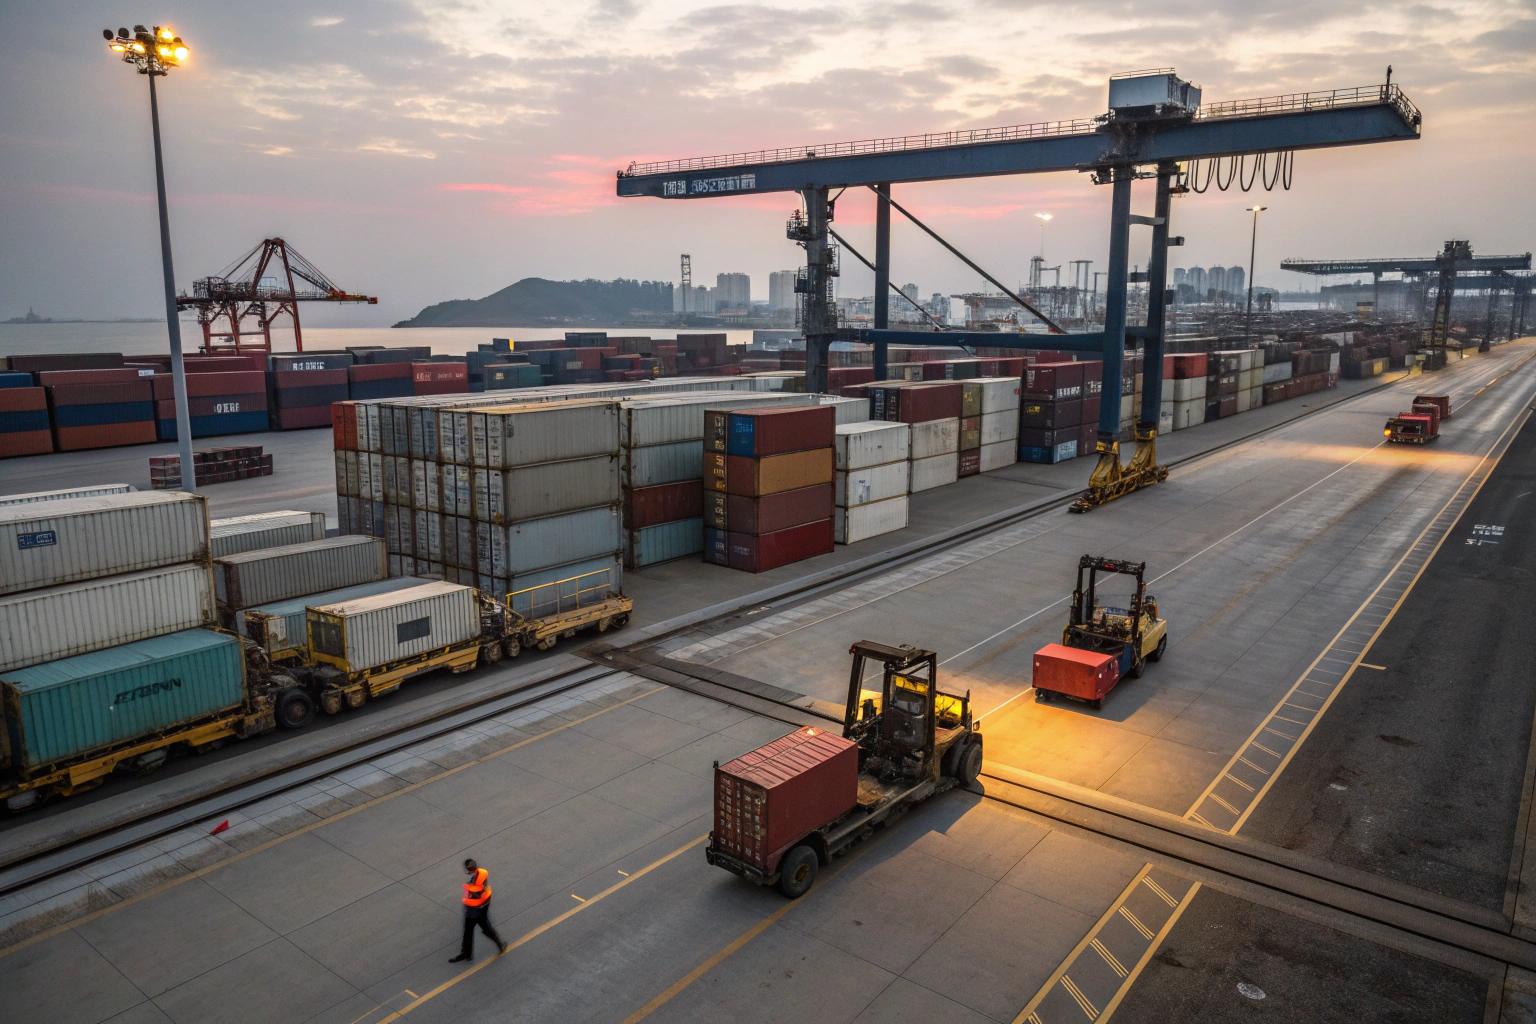
We watch factory readiness and tariff calendars day-by-day. Our buyers often confirm carton counts 10–14 days ahead; we immediately pair them into co-loaded FCLs and reserve blocks on fixed-day strings. We then assign “swing capacity” to airfreight for any SKUs with strict promotions. This is backed by public throughput trends at Ningbo-Zhoushan (20M+ TEU by late June, fastest H1 on record) and Shanghai’s H1 growth—two origins where we aggregate most apparel and gifts. These volumes justify our early bookings and fixed windows on the yard.
Can consolidation really lower unit costs in Q3 2025?
Yes. Shared capacity and STL models trimmed transportation costs ~18% vs. one-off FTL in Q2 2025 benchmarking, and consolidation gives us the leverage to keep allocations when carriers blank sailings. The effect compounds when rates soften, as they did from June→August 2025 on Asia→U.S. lanes. Our clients moved full boxes, not fragments, and didn’t pay rush premiums.
How do we choose the right carriers for co-loads?
We use reliability and cut-off discipline as primary filters. For long-haul Transpacific, we prioritize operators whose on-time performance and terminal windows fit apparel calendars. Learn carrier network and schedule philosophies at Maersk and MSC. We also review sailing strings against port advisories at the Port of Los Angeles and Port of Long Beach. This narrows skip risks and aligns with berth availability during record import months.
What if a buyer demands split-mode allocation?
We’ll allocate a percentage as air “lifeboats” tied to promotions and launch dates. Air security and speed rules factor in; see the U.S. TSA Air Cargo program and integrators’ e-commerce cut-off guidelines such as UPS Air Freight. We recommend weekly review of air volumes versus booking forecasts, plus backup uplift agreements at Shanghai-PVG and Shenzhen-SZX to absorb sudden spikes.
What Cuts Dwell Time: Cross-Docking or Warehousing?
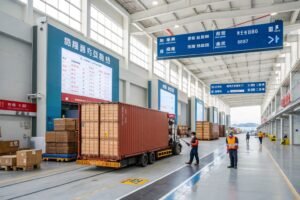
When LA/LB sets throughput records, storage compounds cost. Our second lever is cross-docking at origin and destination. In practice, cross-dock transfers trim 24–36 hours of dwell versus traditional storage workflows, and 2025 playbooks highlight cross-dock as a first-line tactic for peak-season flow.
We break bulk by PO, palletize by store/DC, and tee up outbound trucks the same day the box doors open. In July–August 2025, we ran time-stamped scans that synchronized with destination appointments, so containers exited terminals before free-time clocked out under FMC billing rules.
How much does cross-docking change costs?
In 2025 market notes, cross-docking reduced warehouse handling and storage exposure, particularly when ports were tight. We see the effect in weekly OTR planning and in avoided demurrage/detention disputes when documentation is exact and boxes flow out inside free-time. We benchmark the process against public cost surveys and adjust labor rosters for surge weeks at Shanghai, Ningbo, and Shenzhen to keep “door-to-door DDP” commitments.
What is the operational playbook at the dock door?
We pre-label, pre-cartonize, and sequence outbound lanes so the container is a mobile picking location. Then we scan, sort, and load to outbound legs. Where detention rules are strict, our teams reconcile timestamps line-by-line per FMC requirements (invoice date, free-time window, availability date, earliest return date). That prevents billing shock and keeps truckers moving—critical when LA/LB volumes hit all-time highs.
Why must labels be verified before arrival?
Origin mis-labels cause split shipments and missed appointments. We align A-B carton IDs at the factory and validate HS codes against the U.S. HTS and CBP’s basic import guidance. This avoids manual rework at U.S. CFS facilities and supports true “same-day cross-dock” in peak windows.
Where do we deploy cross-dock sites?
We co-locate near port gates and inland hubs. For practical planning, see facility typologies and throughput drivers at Hapag-Lloyd knowledge pages and Flexport operational guides. Cross-dock placements at Yangshan/Shanghai and Ningbo ensure predictable gate-out timing and tight truck turns to rail ramps or DCs.
Can Predictive Analytics Prevent Port Congestion?
Our third lever is forecasting. We import lane data (FBX, carrier schedules), port TEU releases, and tariff calendars into a weekly capacity model. In late August 2025, Freightos reported China→N. America air prices ~\$5.57/kg and stable China→Europe rates ~\$3.52/kg, while ocean rates drifted lower as orderbooks expanded. We used these signals to pre-move critical SKUs and re-sequence non-urgent freight.
Predictive planning gives us “weeks-ahead” visibility to secure slots before everyone reacts at once. Where models flagged gate congestion, we adjusted free-time, booked night gates, or diverted to alternate ports and ramps. When the LA/LB complex hit record July imports, we used scheduled delivery windows to hold cycle time under two days for priority SKUs.

What datasets power our forecasts?
We fuse FBX weekly indices, port press releases, and carrier OTIs. FBX01 (China/East Asia→USWC) sat near \$1.9k/FEU in W33-2025, while LA/LB broadcasts showed import surges. We also ingest H1 port growth from Ningbo-Zhoushan (20M+ TEUs by late June) and Shanghai H1 throughput gains to time origin pickup windows.
Do we change modes based on the forecast?
Yes. When models anticipate roll risks or late vessel arrivals, we split shipments: ocean for base volume, air for promotional SKUs, rail for inland balance. In August 2025 commentary, analytics firms and forwarders expected rate declines to extend as supply outpaced demand, which reinforced our decision to keep core SKUs on ocean and reserve air only for deadline-bound items.
How do buyers see the forecast?
We share a weekly “capacity brief” with concrete numbers: FBX levels, port TEUs, and booked slots. For context, see public dashboards like Freightos weekly updates and schedule tools at ONE Line. This gives procurement the confidence to launch promotions without guessing logistics capacity.
What happens if a surge hits mid-voyage?
We contract alternate discharge ports and inland ramps ahead of time. Learn port operating updates at the Port of Los Angeles Newsroom and POLB stats. When a surge appears, we land the box where truck capacity is open, then road/rail the last leg to the DC.
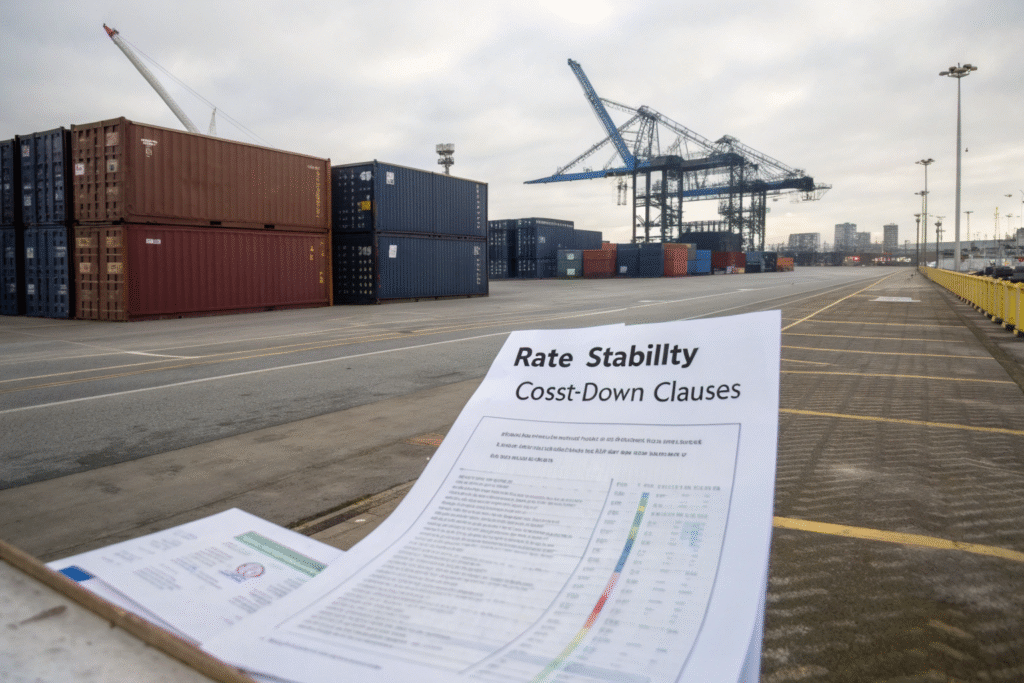
How Do We Keep Asia–US Costs Stable in Q3 2025?
Shippers asked for rate stability as tariff headlines whipsawed booking plans. After a temporary run-up in spring, Xeneta and carriers flagged rate declines from June onward, tied to excess capacity and shifting routings. We used that market glide path to lock mid-term allocations and trigger cost-down clauses—while still reserving surge lanes for air and priority ocean.
Our fourth lever is commercial discipline: pre-agreed rate bands, take-or-pay FAK slices, and a “cap-and-collar” model on core strings. At the same time, we deploy “priority pools” for last-minute cargo so brand launches don’t stall during a price swing.
What evidence supports this cost strategy?
- FBX weekly (W33-2025) shows USWC lanes near \$1.9k/FEU, indicating continued softness.
- Expeditors Q2 2025 reported 7% YoY growth in both air and ocean volumes and 10.5% customs brokerage revenue growth—proof that shippers are pulling freight early and paying for execution, not guesswork.
How does destination execution protect the P&L?
LA/LB performance is ground truth. July 2025 delivered record import TEUs, yet we kept box-to-truck handoff under two days on priority SKUs because we pre-booked delivery windows, used night gates, and staged chassis in advance. That prevents demurrage/detention, which is governed by FMC’s billing requirements (invoice fields, free-time dates, etc.)—we audit those elements to resolve disputes fast.
Can door-to-door DDP stay predictable in volatile markets?
Yes—if documents are right and entries are filed early. Study DDP mechanics via Freightos DDP guide and U.S. entry basics at CBP. We lock HS codes and valuations upstream so duty and tax estimates match the final ledger.
How do we avoid rate whiplash during promos?
We split commitments: a “floor” allocation on ocean at pre-agreed bands and a “floating” tranche tied to FBX triggers. For carrier perspectives on capacity and blank sailings, browse HMM updates and CMA CGM advisories. This lets marketing launch dates proceed even if a lane reprices mid-campaign.
Dive deeper: capacity & cost cheat-sheet (Q3 2025)
| Lever (GeeseCargo) | Public Signal (Jun–Aug 2025) | Practical Outcome |
|---|---|---|
| Space blocks & consolidation | LA/LB imports hit records; FBX softens | Secured slots; unit costs steady |
| Cross-dock execution | FMC billing rules; record import days | Exit terminals inside free-time |
| Predictive planning | FBX W33 ~\$1.9k/FEU; air \$5.57/kg | Mode-split before bottlenecks |
| Commercial discipline | Xeneta sees rate declines | Cap-and-collar protects budgets |
Conclusion
Q3 2025 data is unambiguous. LA/LB recorded the busiest import month on record, FBX West Coast hovered near \$1.9k/FEU, and reputable forwarders reported 7% YoY growth in air and ocean volumes alongside double-digit customs brokerage gains. In the same period, analysts projected further rate declines as capacity outpaced demand. Our answer to that volatility is a four-lever system that blends guaranteed slots, multi-mode agility, cross-dock speed, and predictive planning. The result: boxes gate-out inside free-time, SKUs hit shelves on the week they are promised, and logistics turns from a cost center into a durable commercial advantage.